Too often, investors are guided by their emotions and do not understand how to handle volatility. One result is that they get fearful and sell a stock at exactly the wrong time, especially if they’re not focused on the bigger picture and don’t have a “game plan” in place.
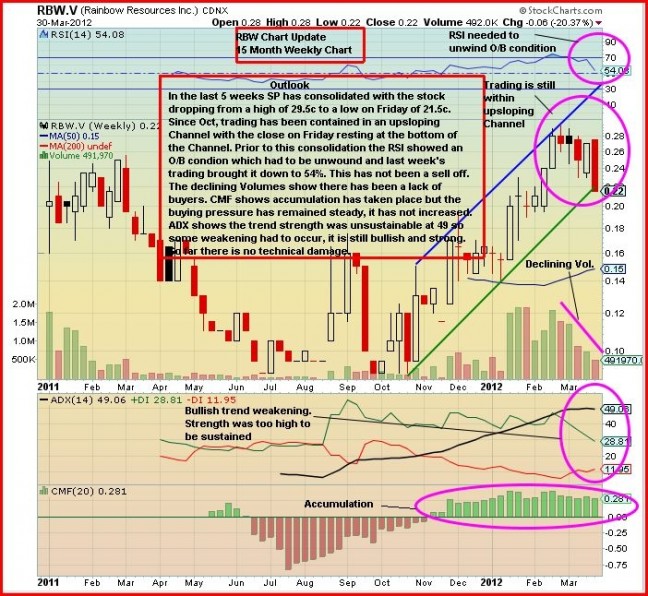
The activity in Rainbow Resources (RBW, TSX-V) the last couple of trading days this month should not rattle anyone who has a basic understanding of technical analysis as well as what the company is all about and the direction it’s going (more on the latter Monday). Rainbow dropped a penny-and-a-half Thursday and another 4 cents Friday to close the week and the month at 21.5 cents. The fall came after news (positive, actually) on a couple of fronts but on low volume, however, as only 212,000 shares in total changed hands on those two days.
Rainbow is one of the few companies on the entire CDNX with rising 50, 100, 200 and 300-day moving averages which confirms that the stock is in a primary uptrend. In situations like this, smart investors will look for pullbacks to areas of strong support to add to existing positions or enter the market for the first time. Below is a 15-month weekly chart from John that should help investors put RBW’s end-of-month weakness into proper perspective.
Note: John and Jon hold positions in RBW (Terry does not) with Jon adding to his position last week.


3 Comments
Thanks for the updated chart John and Jon; I’m sure it is appreciated by many of us – the closing price however, was .215 (not .22) and as a result the 200day SMA is now flat and not rising. Hopefully, the buyers will be back next week and the sellers diminish in volume so that the uptrend will continue. 🙂 Remember though that some investors will have bought at .26 – .27 etc and so they will have cut their losses because the sp dropped more than a tolerable 15 – 20%. I was “too fine”, and waited for entry points so I’m still okay if the buyers come back! 🙂 Enjoy the weekend.
Andrew
You are right, but the chart does not show 1/2c.
Well we all know how quickly those SMA can change with Venture stocks.
Its hard to get excited about a stock that purely speculative at this stage. Prefer instead better valued stocks such as CAN, VTR, LVN and APE.