BMR already has one Tanzanian play (Currie Rose Resources, CUI, TSX-V) which has been a terrific performer of late, more than tripling in value since we first brought it to the attention of BMR readers in September. But what about Sidon International Resources (SD, TSX-V) which continues to hover around a dime after exploding from a low of a nickel in the spring (when we added it to the BMR Portfolio) to 18 cents by early August?
Sidon’s share price has certainly under-performed in recent months but we continue to remain very confident with this company as we believe its Morogoro East Gold Property in east-central Tanzania holds great potential. We also wouldn’t be surprised if the company picked up additional ground in that country. Sidon seems to have a well thought out strategy for Morogoro East and the fact the share price has stalled doesn’t mean there isn’t progress on the ground there – just check out Sidon’s November 15 news release. The company has also hired IR and they’ll soon have a new web site. They’re improving in the important communication area, a concern for us earlier, and this bodes well for the future.
Yesterday, Andrea – one of our many loyal readers – asked about how Sidon looks technically in terms of its chart. So John went to work and has produced an updated chart analysis for SD that readers should find interesting:
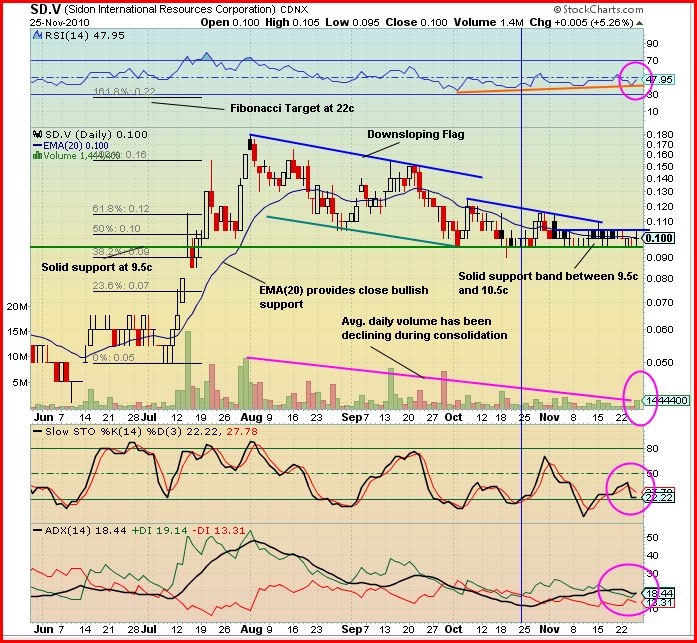
John: Yesterday, Sidon International Resources (SD, TSX-V) opened at 10 cents, drifted to its low of 9.5 cents, rose to its high of 10.5 cents and closed at 10 cents for a gain of half a penny on CDNX volume of 1.4 million shares.
Looking at the 6-month daily chart we see that the price started to move up from consolidation at 5 cents on July 9 and reached a high of 18 cents on August 1. Then for 2 months, until October 1, SD consolidated in a downsloping flag only to drift lower until November 1 when it started to trade in a horizontal trend channel between 9.5 cents and 10.5 cents. It is still trading in this range today. This channel has formed a very strong support band which has not been violated to the downside in the last 19 sessions. The EMA(20) provides strong close bullish support and at present it is at 10 cents, at mid-point of the support channel, exactly where we expect it to be during consolidation.
The set of Fibonacci levels shows the next target as 22 cents (this is not a BMR price target as we don’t give price targets but a theoretical near-term Fibonacci level as a guide for investors based on technical analysis). The average daily volume has been declining since the consolidation began on August 1, nearly 4 months ago, validating the consolidation. The volume yesterday was the highest in the last 8 sessions and was more than 4 times Wednesday’s volume. Volume levels must be watched carefully as rising volume often precedes price.
Looking at the indicators:
The RSI is at 48% and moving off a 2-month upsloping trendline – bullish. The Slow Stochastics has the %K (black line) flat at 22%, below the %D (red line) at 28%, and pointing down. Thus a crossover is possible in the near future. If a crossover does occur it will be low on the scale thus the %K and %D will have plenty of room to move higher before becoming overbought. The ADX trend indicator shows the +DI (green line) crossed up over the -DI (red line) on October 22 and has been bullish ever since. Yesterday, +DI was at 19 and above -DI at 13 with the ADX (black line), the trend strength indicator, rather low and flat at 18. This orientation shows a weak bullish trend.
Outlook: The chart and indicators are telling us that SD has been in a consolidation mode for 4 months and a strong solid support base has been formed. The sign for a move up will be a significant increase in volume and a close above 10.5 cents. We must be patient.


2 Comments
Thank you for the clear and detailed explanation.
Andrea
looks like patience is paying off today…. 🙂