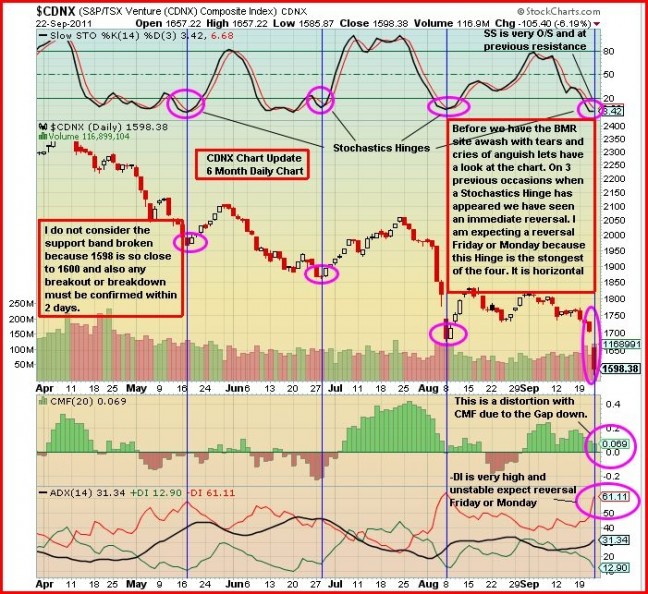
The CDNX took a beating today, dropping 106 points or 6% to 1598. This is a typical situation when many investors panic and let their emotions dictate their trading. And often that means doing the opposite of what they really should be doing.
Technical analysis is so valuable because it helps take “emotion” out of the decision-making process when it comes to buying or selling a stock. Take a look at John’s CDNX chart below and you’ll see that a reversal is likely Friday or Monday based on the “Stochastics hinge” that has formed.


11 Comments
Great, thanks John and Jon for taking the time to present this chart this evening. I haven’t sold a single share and tomorrow or Monday will be very interesting now to watch how the chart develops.
great if your a trader for the short term but over the medium to long haul the overall trend is down.
Reversal is expected because today’s action is over done. Fed stating the obvious (weak economy and financial risk) spooked the market. I’m expecting Fed or someone to try to sooth the market.
However, the market will fall below the current level unless any of the risks are resolved, particularly the euro zone. The market’s been making lower highs and lower lows. The key is selling at the interim top.
bruce, you are correct in selling at the interim top. The cdnx is in a downward trend. yes, it will rebound with green days as nothing keeps going down forever. A fall to 1400 is very possible and with the ups and downs, it could take another month or two to reach that level. Its disturbing that historically the best month for gold is here and yet the markets are getting hammered. This is far from over.
I think your charts are like cocaine to a cocaine drug addict. A quick shorterm rush but in the long run not very healthy for the mind and body or in this case people financials situations. Since february your are calling from your charts a reversal … Better times ! I hope you are realising that charts in difficult financial situation are close to useless.
Andre, what is healthy for the investor is to understand support areas. What John pointed out in the chart last night was a reliable indicator, a Stochastics Hinge, that has consistently marked the bottom or near-bottom of a down-move. This isn’t to say we’re at a final bottom (in fact I believe there is eventually more to go on the downside which should make you happy) but the point is, given the chart, this is likely not the best time to be throwing stocks overboard in a panic. A bounce can be expected. So you’re completely misunderstanding the point of that chart and if you don’t believe in technical analysis, then I’d be curious to know how successful you’ve been in the market over the last couple of years – and if have been, how you do it. Perhaps you can share that with us.
Weekly chart on $CDNX doesn’t look so good at all. We are currently below the 200SMA on the weekly and any volume is being sold into even if volume is picking. I hope you are right and we get a recovery off the fresh oversold lows, but I’m looking at the 1300s and/or a test of the summer 2010 lows real quick in the next quarter.
This much needed correction is coming closer to a completion IMHO. My buy-in prices are approaching. What is worrying me in the short term however are the liquidations from the hedgies, with EU banks set to explode how much gold will get sold off like in 2008, but to reign in ones thoughts about the 2008 sell-off, it wasnt long after (a few months) before gold was making new highs again. So I am going to use this opportunity to load up with a view to the long term. Personally I use a few different peoples charting and make decisions based on the overall average. I am not a tech but understand the basics and I can see the importance of paying attention to charts, its not an exact science but its very helpful and appreciated (John). Right now we have hit stiff support in both gold and silver lets hope it holds as this would be nice level to consolidate at. The situation in Europe is intensifying.
As depressing as these days are for the markets it’s great to see these analyses and have the accompanying interpretation. Thanks.
Hi, Just my two cents worth. Getting to be in range for buying selective stocks. So far Johns tech analysis is right on, another well respected tech. person, Bob Hoye ,two weeks ago said gold would bottom out at 1620 or 1630 then over time rise and top out at $2700 to $2900. Go to money talks.net. richard
I love these days…panic everyone…..panic!!!! Just spents 32,000 dollars on stock that would have cost me triple that two weeks ago and I will reap a huge profit in coming months. Panic people…I love you.