TSX Venture Exchange and Gold
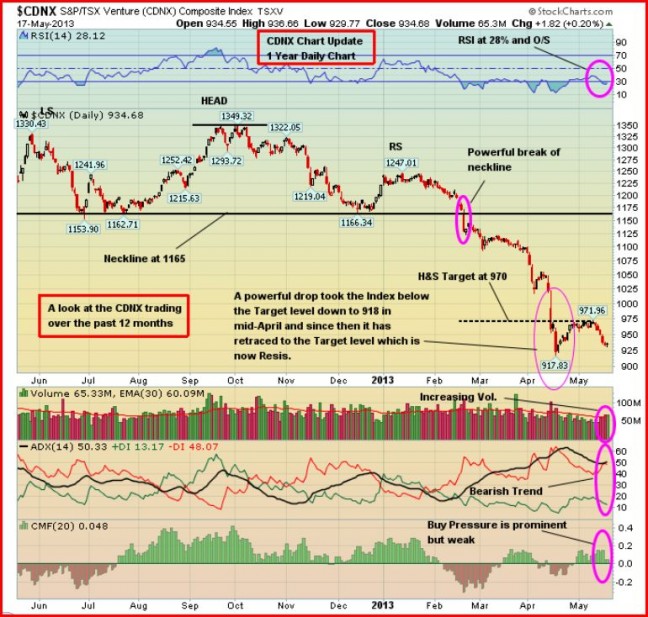
The Venture was unable to climb through important resistance at 970 and fell 32 points last week to close at 935, while the Dow and S&P 500 both surged to new record highs. Still, the Venture fared better than both Gold (down 5.9%) and the TSX Gold Index which plunged 10%. The junior market is having a hard time but producers have fared even worse this year. The TSX Gold Index is down 41% while the Venture is off 23%. On Friday, the Venture actually gained a couple of points despite a $26 drop in Gold and a 3.2% fall in the Gold Index.
What’s important for investors to understand at the moment is that given the fact global equity markets have performed so well in recent months, there is money available and willing to go into speculative opportunities the Venture offers but on a very selective basis. It’s like a market within a market. Discoveries are still drawing the attention of speculators which is why the Iskut River play, led by Colorado Resources (CXO, TSX-V), continues to do so well while the Venture struggles. Follow the money. Investors who have given up entirely on the Venture at this point have made a huge mistake. History has shown that even in the depths of the worst bear market, special situations and opportunities will still arise. It’s still very possible to make a of money in the current Venture environment but this takes patience, discernment, focus and a sharp eye. It’s a very different game now, of course, than it was a couple of years ago. If you adjust accordingly, you can succeed.
Below is an updated 1-year weekly Venture chart from John. The trading range on an intra-day basis since April 17 has been between 918 and 972. Interestingly, we’ve seen weak but steady buying pressure this month – even in recent days despite Gold’s current slump and an $88 drop last week. An important near-term test for the Venture will be whether or not it can hold support at or above last month’s low (918). If not, the next major support area is around 860 as John has shown on previous charts. Regardless, the Iskut River play should continue to out-perform as it behaves as a market within a market. Obviously, always watch carefully for any important new discoveries – they don’t occur often but have a tendency to appear when overall market conditions look the bleakest.
Gold
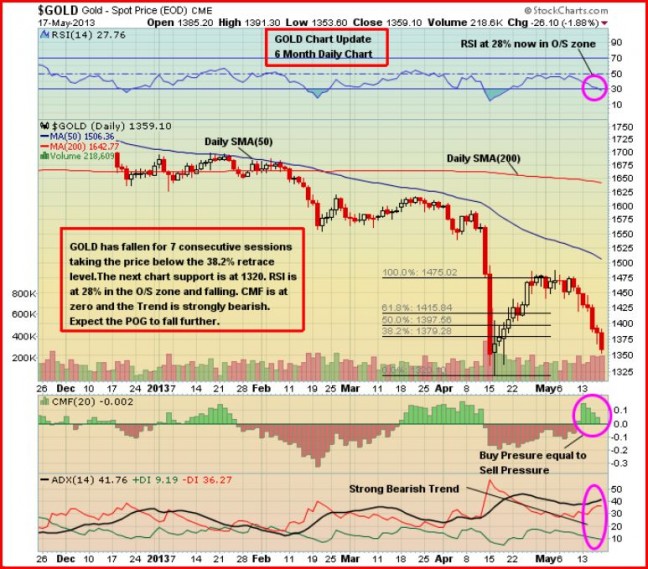
Gold got hit hard last week and as John’s charts have shown, the primary trend is clearly negative. Within the current primary trend – one that ultimately could drive Gold down to $1,100 an ounce – there will be rallies and sub-trends. “As equities continue to rally and inflation data fails to show inflation, I don’t see any reason to own Gold, unless you like how it looks on the shelf,” said Adam Klopfenstein, senior market strategist in Chicago with brokerage firm Archer Financial Services (source: CNBC).
Gold is in the midst of its longest losing streak since the financial crisis with 7 consecutive losing sessions. For the week, bullion was off $88 an ounce to close at $1,360. The question now is, will it hold support over the coming days/weeks at the April low of $1,321? That’s impossible to predict based on TA and will likely largely depend on the amount of physical buying that comes into the market from China and elsewhere. As of Tuesday, large money managers and hedge funds held a record number of bets on lower Gold prices, according to weekly data from the Commodity Futures Trading Commission released Friday.
Below is a 6-month daily chart from John.
Over 380 metric tons of Gold has been sold by Gold-backed ETF’s so far this year, according to ETF Securities. That decline is more than the combined annual Gold production of the U.S. and Canada. To compare, 279 tons of Gold flowed into ETF’s in 2012, according to the World Gold Council.
Speaking of the World Gold Council, it issued its first quarter 2013 Gold Demand Trends report last week. The council showed that demand for Gold bars and coins was 10% higher in the first quarter compared to a year earlier, while demand for jewellery increased 12%. Similarly, central banks’ net purchases exceeded 100 tonnes for the 7th consecutive quarter. It is worth mentioning that these numbers provide evidence of strong physical demand from all sectors, even prior to the widely disseminated news of the skyrocketing demand for physical Gold that followed the mid-April record sell-off.
Credit Suisse issued a report that said Gold will trade at $1,100 an ounce in a year (very possible in our view) and below $1,000 in five years (not sure about that), implying lower than expected inflation expectations and further weak sentiment for the commodity sector overall.
Silver fell 6.7% or $1.61 an ounce last week to close at $22.86. Copper was off a nickel to $3.30. Crude Oil was essentially unchanged at $96.02 while the U.S. Dollar Index continued to surge, putting pressure on Gold. It gained more than a point to finish at 84.21.
The “Big Picture” View Of Gold
As Frank Holmes so effectively illustrates at www.usfunds.com, the long-term bull market in Gold has been driven by both the Fear Trade and the Love Trade. The transfer of wealth from west to east, and the accumulation of wealth particularly in China and India, has had a huge impact on bullion. Despite its current weakness, the fundamental long-term case for Gold remains incredibly strong – currency instability and an overall lack of confidence in fiat currencies, governments and world leaders in general, an environment of historically low interest rates, a Fed balance sheet now in excess of $3 trillion and expanding at $85 billion a month, money supply growth around the globe, massive government debt from the United States to Europe, central bank buying, flat mine supply, physical demand, emerging market growth, geopolitical unrest and conflicts…the list goes on. However, deflation is prevailing over inflation in the world economy and this had a lot to do with Gold’s recent plunge below the technically and psychologically important $1,500 level, along with the strong performance of equities which are drawing money away from bullion. Where and when Gold bottoms out in this cyclical correction is anyone’s guess, but we do expect new all-time highs later in the decade. There are many reasons to believe that Gold’s long-term bull market is still intact despite a major correction from the 2011 all-time high of just above $1,900 an ounce.


1 Comment
GOOD TO FINALLY SEE BMR SEE THAT THE CXO AND IT’S AREA PLAY WILL BE DRAWING LOT’S OF ATTENTION GOING INTO THE SUMMER MONTHS!….CXO WENT UP 50-60 CENTS DURING FRIDAY! OTHER JUNIORS COMING INTO THE AREA WILL FOLLOW AS IT IS THE HOTTEST PLAY OUT THERE RIGHT NOW (BESIDES AMW).