TSX Venture Exchange and Gold
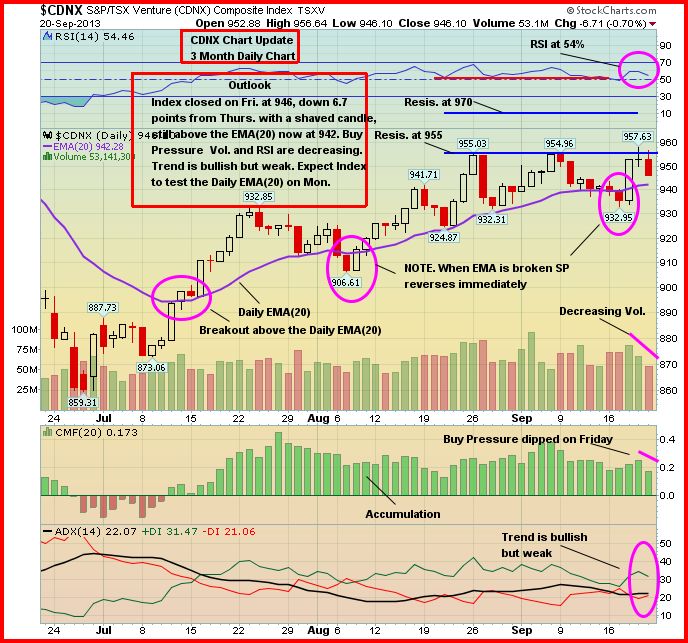
The Venture posted a modest 4-point gain last week, closing at 946. Though the Index slipped 7 points Friday (its worst day of the week but also its lowest volume session of the week), it held up well considering the 185-point plunge in the Dow and a $39 drop in the price of Gold. The Venture has essentially shrugged off several sharp down days in Gold this month, a very encouraging sign, and continues to find strong support at its EMA(20) as shown in this 3-month daily chart from John.

The Venture’s rising 50-day moving average (SMA) has now crossed above the 100-day SMA, a typically bullish technical event that has occurred on only five occasions since the 2008 Crash. The next few weeks, however, will be critical to see if this modest bullish trend can hold and gain momentum. The Index is trading in a tight range, underpinned by solid support but also restrained by a strong resistance band between 955 and 970. The slow but gradual recovery since the late June low of 859 has been encouraging. One or more catalysts, such as an important new discovery or a sharp rise in Gold prices, will be necessary to push the Index through resistance which would attract a wave of fresh buying. We remain optimistic – we do like the odds of a breakout, but exact timing of that is anyone’s guess.
The Seeds Have Been Planted (And Continue To Be Planted) For The Next Big Run In Gold Stocks
There’s no better cure for low prices than low prices. The great benefit of the collapse in Gold prices this year is that it forced producers to learn to become much more lean and mean in terms of their cost structures. Among many others, Barrick Gold (ABX, TSX), the world’s largest producer, said it may sell, close or curb output at 12 mines from Peru to Papua New Guinea where costs are higher. Producers, big and small, have started to make hard decisions in terms of costs, projects, and rationalizing their operating structures. Exploration budgets among both producers and juniors have also been cut sharply. In addition, government policies across much of the globe are making it more difficult (sometimes impossible) for mining companies to put Gold (or other) deposits into production, thanks to the ignorance of many politicians and the impact of radical and vocal environmentalists. Ultimately, all these factors are going to create a supply problem – think about it, where are the next major Gold deposits going to come from? On top of that, a recent Mineweb study shows grades have indeed fallen significantly just over the past decade. For instance, grades in the South African Gold sector fell from an average of 4.3 grams per metric ton in 2002 to an average of 2.8 grams per metric ton in 2011. It doesn’t take a rocket scientist to figure out that the next huge bull market in Gold stocks is just around the corner due to demand-supply dynamics, much leaner producers who will suddenly become earnings machines, and a junior market that will be healthier simply because a lot of the “lifestyle” companies sucking money out of investors will simply disappear or get taken over by individuals or groups who are actually competent and serious about building shareholder value. A healthy “cleansing” in the market has been taking place. As this continues, more and more seeds are being planted for an incredible future move in well-managed Gold producers and explorers that could make the dotcom bubble look like a tea party. As for the juniors, focus on the small universe of companies that have the ability to execute both on the ground and in the market – companies that have the cash, the expertise, the properties and the drive to make discoveries that majors will buy.
Gold
Gold took investors on a wild roller coaster ride last week, courtesy of the Federal Reserve. The Fed surprised most pundits Wednesday by not electing to scale back its bond-buying program, and bullion took off from $1,300 into the $1,370’s. Much of that jump was likely due to short-covering. On Friday, Gold gave up a lot of its gains due to comments from Fed official James Bullard who said the decision not to taper was a “close one” and that the Fed could decide to begin scaling back as soon as its next meeting in October (we doubt it). Consistent messaging from the Fed is certainly not one of its strengths.
While most analysts and economists got the call wrong on the Fed’s decision to keep its bond purchases intact at $85 billion a month, Bank of America Merrill Lynch called it correctly all along as CNBC’s Jeff Cox pointed out in an interesting article Thursday. The firm had been saying for months that economic improvements would not be sufficient to budge the Fed from its historically easy monetary policy, making a September taper unlikely and a December move more probable. “We believe tightening is unlikely to happen until higher bond yields, bank stocks, housing activity and corporate ‘animal spirits’ all signal in unison that policy has traction,” Michael Hartnett, BofAML’s chief investment strategist, said in a note to clients. The firm remains bullish on stocks.
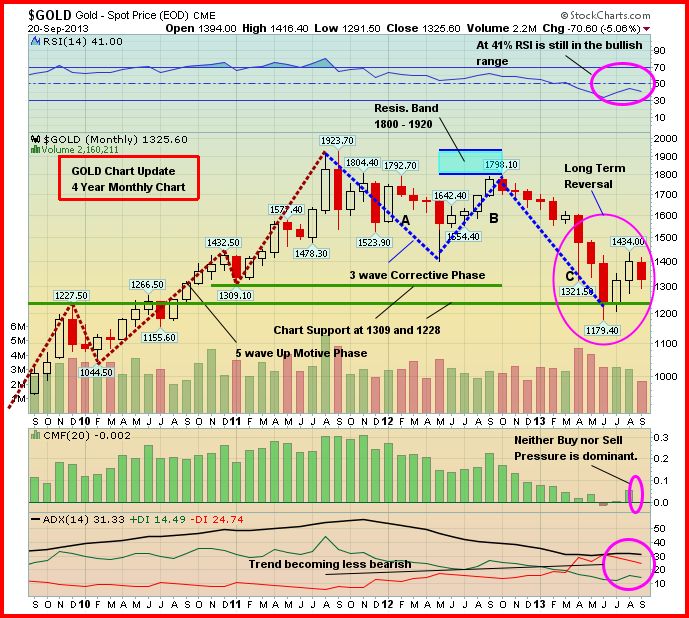
Looking at the “Big Picture” with regard to Gold, what we see from a technical point of view (below is a 4-year monthly chart) is an important reversal this summer – a “3-wave” corrective phase that ended when Gold touched $1,179 in late June. At the same time, of course, the Venture hit a low of 859 while the TSX Gold Index plunged to a level (154) not seen since the height of the 2008 panic which presented the opportunity of a lifetime for investors.

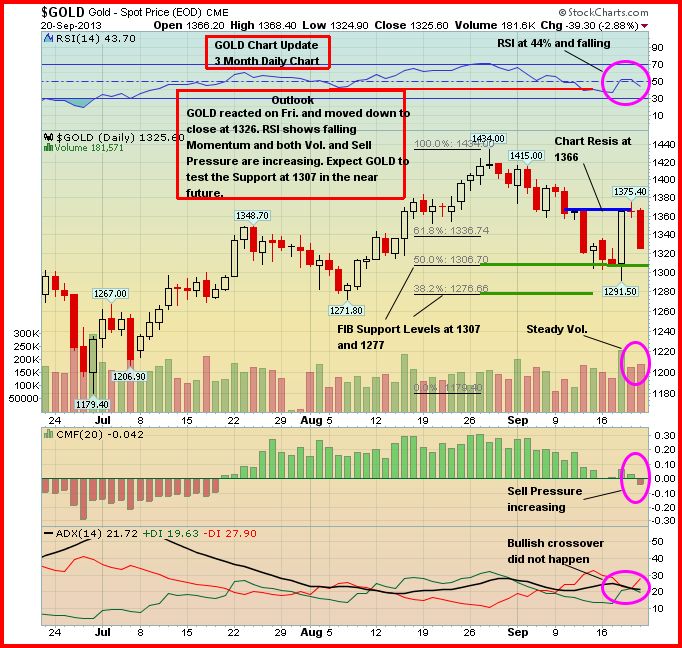
Gold 3-Month Daily Chart
Gold has shown strong support at the $1,307 Fib. level which could certainly be tested again this coming week ($1,277 is another important Feb. support level). However, we remain encouraged by the fact that the Venture – a reliable leading indicator of Gold prices – is actually up slightly this month while bullion has fallen 4.9% from $1,397 at the end of August. We doubt the Venture would be showing the resilience it is if Gold were about to collapse again as some pundits are predicting (many of the same pundits also insisted the Fed would start “tapering” this month). Keep in mind also that the Gold price has correlated extremely well with the U.S. debt ceiling over the last few years. The debt ceiling will need to be increased again during Q4.
Gold finished a volatile week very close to where it closed the previous Friday – down $2 an ounce at $1,326.

Silver fell $1.29 an ounce Friday to finish at $21.80, a loss of 47 cents for the week (John will have updated Silver charts tomorrow as usual). Copper enjoyed a strong week, climbing a dime to $3.28. Crude Oil slipped $3.46 a barrel to $104.75 while the U.S. Dollar Index plunged nearly 2 points to 80.43 (it has broken a 2.5-year uptrend which has to be considered bullish for both Gold and the Venture).
The “Big Picture” View Of Gold
As Frank Holmes so effectively illustrates at www.usfunds.com, the long-term bull market in Gold has been driven by both the Fear Trade and the Love Trade. The transfer of wealth from west to east, and the accumulation of wealth particularly in China and India, has had a huge impact on bullion. Despite this year’s drop, the fundamental long-term case for Gold remains incredibly strong – currency instability and an overall lack of confidence in fiat currencies, governments and world leaders in general, an environment of historically low interest rates, a Fed balance sheet now in excess of $3 trillion and expanding at $85 billion a month, money supply growth around the globe, massive government debt from the United States to Europe, central bank buying, flat mine supply, physical demand (especially from China), emerging market growth, geopolitical unrest and conflicts…the list goes on. However, deflation is prevailing over inflation in the world economy and this had a lot to do with Gold’s plunge during the spring below the technically and psychologically important $1,500 level, along with the strong performance of equities which drew money away from bullion. June’s low of $1,180 may have been the bottom for bullion – time will tell. We do, however, expect new all-time highs as the decade progresses. There are many reasons to believe that Gold’s long-term bull market is still intact despite this major correction from the 2011 all-time high of just above $1,900 an ounce.

5 Comments
Sorry my post re ACN should have read asher resources. Could be well worth while having a looksee. Positioned in pgx and ggi, waiting for truth machine. Richard l
Jon,
check out lyd.to …
azc?
TWO watch lists graphite up 30 percent colorado area play down 25 percent watch list about 60 days old.I think grahite is the place to be its hot hot now
For those who like silver and gold but still want a huge upside graphite potential check out gta
Gill,
Could be good for RBW if they place their graphite play in the news.