TSX Venture Exchange and Gold
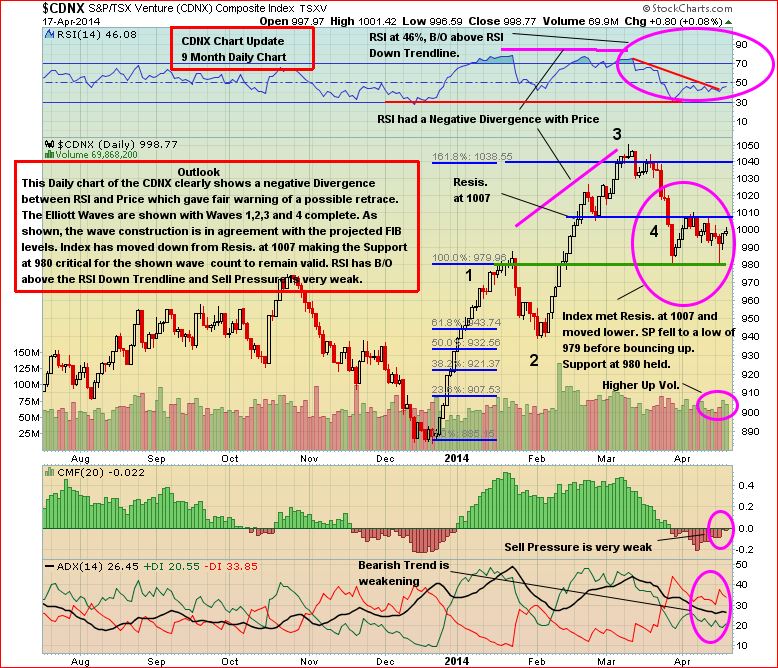
The Venture gained a mere 1 point this week but it was an important week, nonetheless, as the Index staged an impressive turnaround intra-day Tuesday after testing strong support around 980, and then closed Thursday at 999 with RSI(14) on this 9-month daily chart pushing above a downtrend line in place for the past month. Sell pressure has declined significantly. The stage appears to be set for a move back above the 1000 level next week. The fact that the Venture held steady this week while bullion and the TSX Gold Index fell 1.7% and 2.2%, respectively, is certainly encouraging.
Venture 9-Month Daily Chart

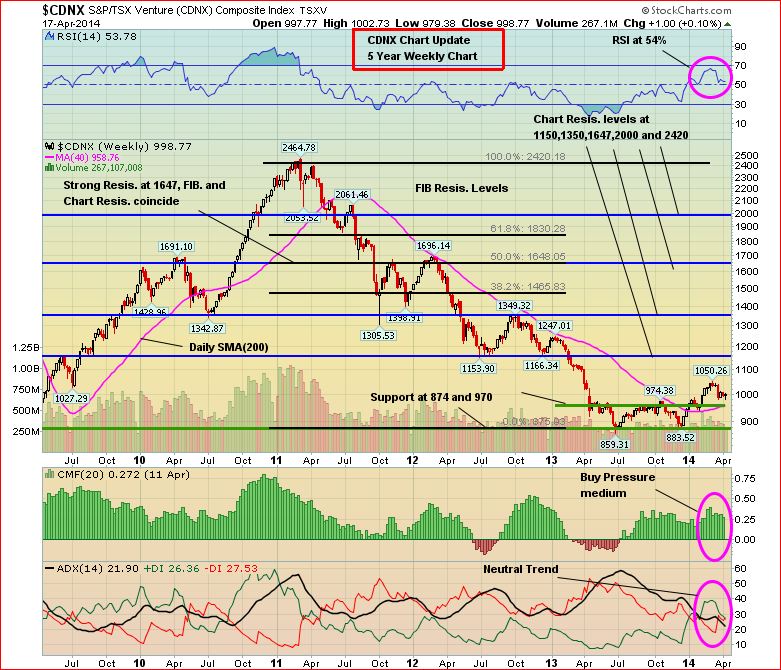
Venture 5-Year Weekly Chart
This 5-year weekly chart demonstrates how the Venture is now in the very early stages of a new bull phase with the 200-day moving average (SMA) now rising, ending a 2+ year decline, and joining exceptional chart support around 970. What this chart is telling us is that there’s a strong probability of a major move to the upside in the Venture during 2014, so prepare now before the masses start piling back in. Smart money has been accumulating for several months.
Ultimately, 1650 on the Venture – a whopping 65% advance from today’s level – is very conceivable over the next 12 months in our view given this market’s current technical posture. If you think that’s far-fetched, keep in mind that the Athens (Greece) Stock Exchange surged 71% in just nine months from mid-July last year to the middle of last month. The masses were treating Greece like it was radioactive a year ago (sound familiar, re: the Venture?). That’s always when the opportunity is the greatest, just like it is now with the Venture. Patient, astute investors have an opportunity to make a fortune over the next 6-12 months.

The Seeds Have Been Planted (And Continue To Be Planted) For The Next Big Run In Gold Stocks
There’s no better cure for low prices than low prices. The great benefit of the collapse in Gold prices in 2013 is that it forced producers (at least most of them) to start to become much more lean in terms of their cost structures. Producers, big and small, have started to make hard decisions in terms of costs, projects, and rationalizing their their overall operations. Exploration budgets among both producers and juniors have also been cut sharply. In addition, government policies across much of the globe are making it more difficult (sometimes impossible) for mining companies to put Gold (or other) deposits into production, thanks to the ignorance of many politicians and the impact of radical and vocal environmentalists (technology has made it easier for groups opposing mining projects to organize and disseminate information, even in remote areas around the globe). Ultimately, all of these factors are going to create a supply problem – think about it, where are the next major Gold deposits going to come from? On top of that, grades have fallen significantly just over the past decade.
It doesn’t take a rocket scientist to figure out that the next huge bull market in Gold stocks is just around the corner due to demand-supply dynamics, much leaner producers who will suddenly become earnings machines, and a junior market that will be healthier simply because a lot of the “lifestyle” companies sucking money out of investors will simply disappear or get taken over by individuals or groups who are actually competent and serious about building shareholder value. A healthy “cleansing” in the market has been taking place. As this continues, more and more seeds are being planted for an incredible future move in well-managed Gold producers and explorers that could make the dotcom bubble look like a tea party. As for the juniors, focus on the small universe of companies that have the ability to execute both on the ground and in the market. Companies that are strong financially, have superior exploration prospects, competent management and clean share structures.
Gold
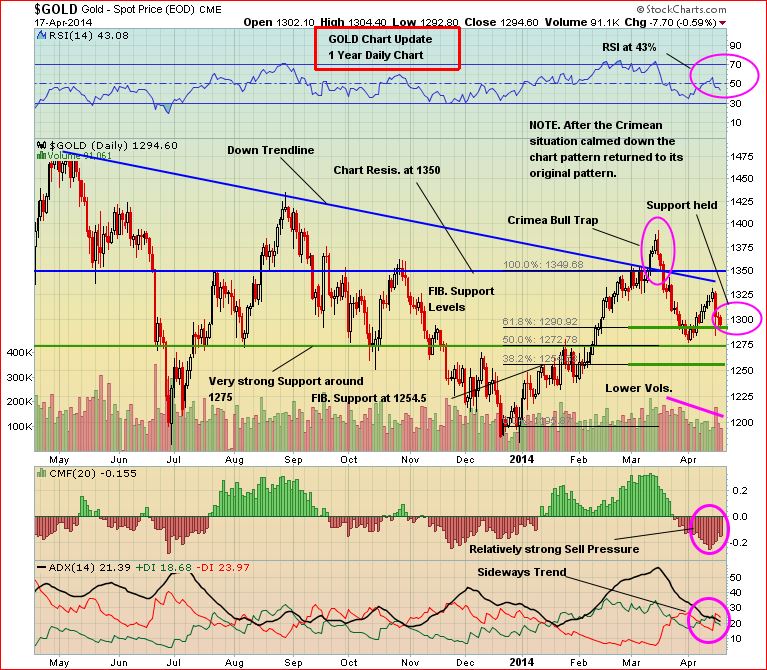
Gold fell $23 an ounce or $1.7% this week as China reported a significant drop in money supply growth to 12.1% year-over-year in March, an historic low, while the World Gold Council estimated that demand in the world’s biggest Gold consumer is likely to stay flat in 2014(demand for bullion in China has expanded every year since 2002, when it declined). However, over the longer term, the WGC predicts that China’s appetite will rev up again with demand, excluding factory stockpiles, jumping about 20% by 2017 to 1,350 metric tons. As China’s economy continues to expand and citizens become more affluent, more of them are expected to purchase Gold jewelry or bullion for the first time. By 2020, China’s middle class is expected to grow from 200 million people to 500 million.
Bullion has very solid chart and Fib. support around $1,275, as you can see below, while important resistance is at $1,350, just above a downtrend line. That will be the key area for Gold to push above and remain above in order to create the conditions for a sustained advance. Over the past 10 months it appears that bullion has been forming a bullish cup-with-handle pattern with the handle now under construction and the $1,270′s acting as support.

Silver closed Thursday at $19.63, down 33 cents from last Friday, while Copper was unchanged at $3.03. Crude Oil strengthened to $104.30 while the U.S. Dollar Index climbed more than one-third of a point this week to finish at 79.88.
The “Big Picture” View Of Gold
As Frank Holmes so effectively illustrates at www.usfunds.com, the long-term bull market in Gold has been driven by both the Fear Trade and the Love Trade. The transfer of wealth from west to east, and the accumulation of wealth particularly in China and India, has had a huge impact on bullion. Despite Gold’s largest annual drop in three decades in 2013, the fundamental long-term case for the metal remains solidly intact – currency instability and an overall lack of confidence in fiat currencies, governments and world leaders in general, an environment of historically low interest rates, a Fed balance sheet now at $4 trillion and still expanding, money supply growth around the globe, massive government debt from the United States to Europe, central bank buying, flat mine supply, physical demand (especially from China), emerging market growth, geopolitical unrest and conflicts…the list goes on. However, deflationary concerns around the globe and the prospect of Fed tapering had a lot to do with Gold’s plunge during the spring of 2013 below the technically and psychologically important $1,500 level, along with the strong performance of equities which drew “momentum traders” away from bullion. June’s low of $1,179 was likely the bottom for Gold. Extreme levels of bearishness emerged in the metal last year. With the long-term bull market remaining intact, we expect new all-time highs in Gold as the decade progresses. Inflationary pressures should eventually kick in around the globe after years of ultra-loose monetary policy.

5 Comments
Have a great Easter weekend BMR!
The Shesley Valley got some Press in the latest issue of Resource World, all the main players mentioned.
Greg- the apr/may issue??
V.GGI 106.25%
V.HBK 70.00%
T.SAM -8.11%
V.IO 8.33%
V.TGK -33.33%
V.GTA -25.00%
V.KWG 40.00%
V.RBW -37.50%
V.FMS 55.88%
V.PGX 44.93%
V.GBB -12.50%
V.GMZ -37.50%
bmr members picks
120.32
Greg J
Yes the April /May issue