TSX Venture Exchange and Gold
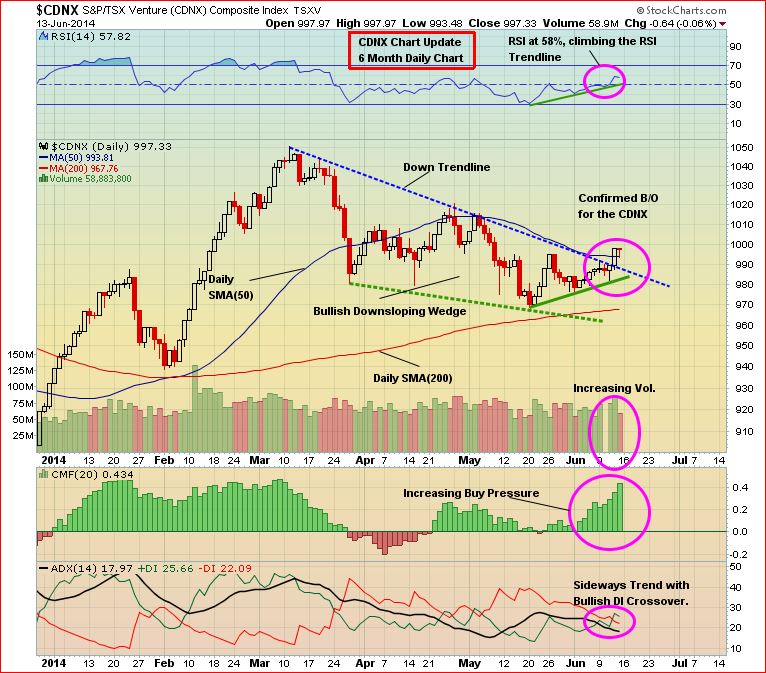
The Venture‘s technical dynamics remain EXTREMELY favorable, and in fact the Index confirmed a breakout Friday above a short-term downtrend line in place since the mid-March high of 1050 (see chart below). Thanks to an upturn in Gold and Oil prices, the Venture posted a 10-point gain last week to close at 997.
What we’re focused on now is the 1150 resistance level, a powerful 15% potential move from here. Within that kind of bullish environment expected immediately leading up to and during Q3, similar to the advance between late December and mid-March in Q1, astute investors will profit handsomely as a significant number of stocks should experience rather dramatic gains. The doomsayers, those who became discouraged and threw in the towel with this market after the very healthy and normal pullback from the March high to the rock-solid support around 970, have made a profound miscalculation. Yes, those are strong words but the technical case for the Venture right now is unusually strong – it has been that way, in fact, since the breakout above the long-term downtrend line last October as we have pointed out on so many occasions. A vast majority of investors typically lag behind – they don’t realize a bull or bear market is over until well after the fact.
For those who lament about the “weak” fundamentals of so many companies in the context of working capital, keep this in mind: Yes, there are many Venture listings at the moment that are dealing with working capital deficits, but that doesn’t mean they’re all about to disappear (some will which is good). Within this group there remains a good percentage with very attractive upside share price potential, companies with impressive human capital that are also sitting on valuable assets. Pilot Gold (PLG, TSX) recognized this in Cadillac Mining Corp. (CQX, TSX-V) and announced a friendly all-share buyout Friday that drove CQX all the way up to 20.5 cents after it was trading as low as 5.5 cents June 5. Cadillac’s latest financials showed a working capital deficit of more than $1 million, but it was nonetheless a superb opportunity for investors given the value and potential of its Goldstrike Project in southwestern Utah. There are a lot of other “Cadillacs” out there.
Venture 6-Month Daily Chart
On increasing volume and buy pressure, the Venture has pushed above a short-term downtrend line with confirmation of this breakout Friday. The next stage of the primary uptrend is under way and should begin to accelerate either immediately or very soon. Significantly, the Venture’s 300-day moving average (SMA) is slowly starting to reverse to the upside after being in decline since late 2011. Momentum is now clearly on the bulls’ side and a lot of money could come surging into this market over the next few months. It’s time for the bears to go into hibernation.
Venture 5-Year Weekly Chart
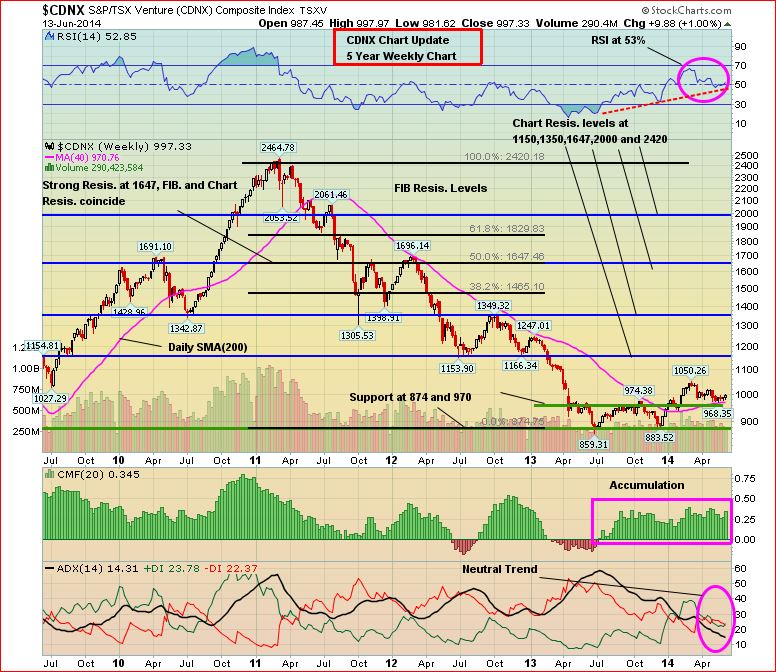
It’s important to point out that RSI(14) on John’s 5-year weekly chart found a “comfort zone” in the immediate vicinity of the 50% level, as expected. A modestly overbought condition in the RSI(14) that emerged in March when the Index hit 1050 gradually unwound, with RSI(14) now on the upswing again. The recent decline that took the Venture to a monthly intra-day low of 968 May 20 came on light volume, and accumulation (CMF indicator) remains steady and strong – the most extended period of healthy accumulation we’ve seen, actually, in a few years.
In the not-too-distant future, investors will look back at the correction from 1050 as an incredible buying opportunity. The nervous nellies who were sellers as opposed to buyers in recent weeks – well, they bet on the highly improbable which was a breakdown of superb Venture support. The Venture will take the path of least resistance which means a significantly higher market over the coming months – perhaps not the mainstream view, but you don’t make big money by following the crowd.
The Venture’s rising 200-day moving average (SMA) on this weekly chart is at 971. The third quarter for the Venture is shaping up to be a very dynamic period. Patience and a game plan, as always, are key.
The Seeds Have Been Planted (And Continue To Be Planted) For The Next Big Run In Gold Stocks
There’s no better cure for low prices than low prices. The great benefit of the collapse in Gold prices in 2013 is that it forced producers (at least most of them) to start to become much more lean in terms of their cost structures. Producers, big and small, have started to make hard decisions in terms of costs, projects, and rationalizing their their overall operations. Exploration budgets among both producers and juniors have also been cut sharply. In addition, government policies across much of the globe are making it more difficult (sometimes impossible) for mining companies to carry out exploration or put Gold (or other) deposits into production, thanks to the ignorance of many politicians and the impact of radical and vocal environmentalists (technology has made it easier for groups opposing mining projects to organize and disseminate information, even in remote areas around the globe). Ultimately, all of these factors are going to create a supply problem – think about it, where are the next major Gold deposits going to come from? On top of that, grades have fallen significantly just over the past decade.
Gold
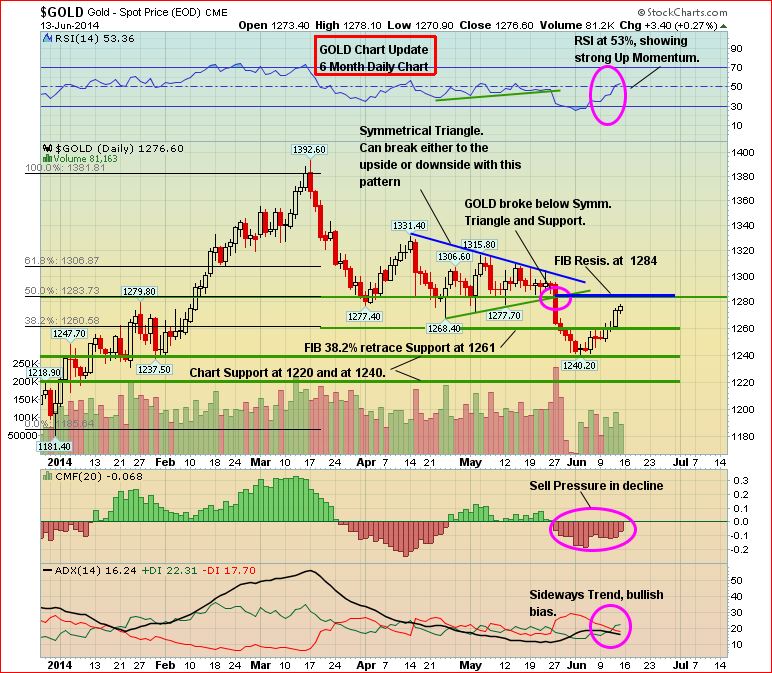
Gold pushed above resistance at $1,260 last week and closed Friday at $1,276 for a weekly gain of $24. Events in Iraq were certainly the catalyst with Crude Oil surging to a new 9-month high. This morning in Ukraine, a Ukrainian military plane was shot down (49 people killed) by pro-Russian separatists using anti-aircraft guns, likely courtesy of Vladimir Putin (the flow of heavy weapons and militants from Russia into Ukraine continues). There are hot spots in different areas of the globe, and a Jimmy Carter clone in the White House at the worst possible time. So it’s quite possible that geopolitical instability will be a major theme in the months ahead, and at the very least this should put a floor underneath Gold prices to keep them above last year’s lows. Potentially, bullion could surprise to the upside, especially if Crude Oil (WTIC) busts through major resistance around $110 a barrel.
In the week ahead, it’ll be interesting to see how Gold handles Fib. resistance in the $1,280’s as you can see in John’s 6-month daily chart.
Silver jumped 66 cents last week to close at $19.67. Copper fell another 2 pennies to $3.03. Crude Oil climbed $4.25 a barrel to $106.91 while the U.S. Dollar Index was up one-fifth of a point to 80.61.
The “Big Picture” View Of Gold
As Frank Holmes so effectively illustrates at www.usfunds.com, the long-term bull market in Gold has been driven by both the Fear Trade and the Love Trade. The transfer of wealth from west to east, and the accumulation of wealth particularly in China and India, has had a huge impact on bullion. Despite Gold’s largest annual drop in three decades in 2013, the fundamental long-term case for the metal remains solidly intact – currency instability and an overall lack of confidence in fiat currencies, governments and world leaders in general, an environment of historically low interest rates, a Fed balance sheet now at $4 trillion and still expanding, money supply growth around the globe, massive government debt from the United States to Europe, central bank buying, flat mine supply, physical demand (especially from China), emerging market growth, geopolitical unrest and conflicts…the list goes on. However, deflationary concerns around the globe and the prospect of Fed tapering had a lot to do with Gold’s plunge during the spring of 2013 below the technically and psychologically important $1,500 level, along with the strong performance of equities which drew “momentum traders” away from bullion. The June 2013 low of $1,179 was likely the bottom for Gold. Extreme levels of bearishness emerged in the metal last year. With the long-term bull market remaining intact, we expect new all-time highs in Gold as the decade progresses. Inflationary pressures should eventually kick in around the globe after years of ultra-loose monetary policy.


11 Comments
GBB is the next CQX!
Marc
I was just thinking the same. In fact GBB is far more advanced than CQX (historical data).
But good to see a take out at 120% of recent trading value. GBB should be finalizing their custom-
milling agreement with Iamgold (have until end of June); and concurrently non-equity financing of
the rolling start. Mid-tier co’s will be looking to add to their project portfolios as market
conditions improve.
anyone here follow grg.v. seems cheap. huge silver deposit. is Argentina really that bad.
About our last discussion, Jon, One hole, C, will in fact test known mineralization at depth, This could also be a game changer.
Possible, Martin, but I’m more curious as to what develops laterally out to Star North and Star East. Two critical areas, and if mineralization extends to there, then PGX is onto something very big. There is reason to believe that grades could also increase going north.
AG grade from rock sampling was better in Star North from NI43-101 2010-11 did by FTR
I would focus on PGX’s data, Martin, which I believe is more complete and reliable. The gold geochem going north is exciting, and the geophysics match up very well.
Where do we see that Jon?
Ok, figure 4.
That Star east would be as good
JUST NOTICED VENTURE AT 1001 RIGHT NOW!