TSX Venture Exchange and Gold
Venture momentum, not surprisingly, has picked up significantly following the confirmed breakout above a short-term downtrend line June 13 as explained in the June 14 Week In Review And A Look Ahead. It’s critical to understand that this is not a bear market rally like the ones witnessed during the second half of 2011, the early part of 2012 and the summer of 2012. A fundamental change has occurred. This is a primary new uptrend, born late last year as John’s charts have repeatedly shown, and it’s now picking up steam in time for what should be a very robust third quarter. Investors who play their cards right could make fortunes during the second half of 2014. Selectivity will be key as a rising tide will not lift all boats (more boats hopefully will sink and thus further reduce the clutter of garbage that remains floating on the sea of the Venture).
The many nervous nellies who were following the crowd out of Gold and Silver and the junior resource sector over the last year, even during the last couple of months on a normal and healthy pullback in the Venture, made a profound miscalculation, but that was the final capitulation that perhaps was necessary. It was the mirror image of almost everyone “all in” in late 2010/early 2011 when the market topped out and then plunged by two-thirds in just over two years.
The Venture surged 29 points last week on increased volume to close Friday at 1026, its highest level in more than three months. The Venture has been telegraphing a sentiment turn in Gold by out-performing the yellow metal for about a year – that was a very telling pattern change, and we’ve just started to see the significance of that with bullion’s fresh breakout.
The Venture, Gold, Crude Oil, the CRB – they’re all telling us the same thing: Inflationary pressures are finally starting to click in, and central banks around the world – in particular the Fed – are going to be caught behind the curve. At some point, interest rates will have to increase, and that’s also going to cripple governments from Ontario (voters there just got sold down the river by a fiscally/economically illiterate Kathleen Wynne) to Washington to Japan, and Gold is going to skyrocket – but that’s another topic for another day.
Let’s look at where the Venture is currently at, both in terms of new support and resistance.
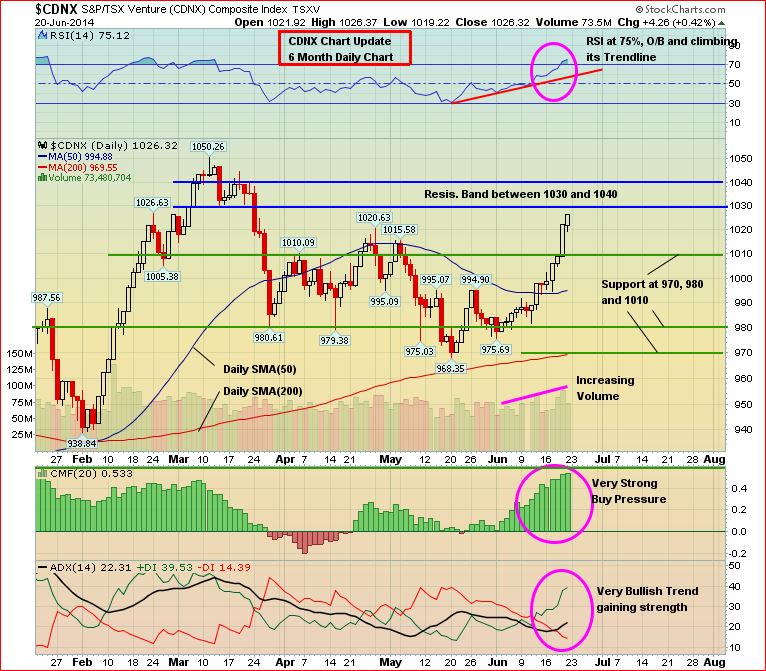
The rapidly increasing buy pressure and the volume uptick reflect a growing understanding among astute traders and investors that the Venture is indeed in a bullish new cycle that should result in stellar gains during Q3. While RSI(14) on this 6-month daily chart is now in overbought territory at 75%, it’s very possible these conditions could persist for a while given the intensity of the momentum. Keep in mind, the Venture’s 50-day and 300-day moving averages (SMA’s) are just now reversing to the upside – this is powerful confirmation of an impending bullish advance. The bulls are in control and they are going to set the pace.
It could take a little time for the Venture to grapple with a resistance band between 1030 and 1040, but there is very strong support around 1010. The possibility of a rapid surge through the 1050 March high certainly exists. The 1050 area will be taken out – the only question is how soon, not if.
Venture 6-Month Daily Chart
Venture 5-Year Weekly Chart
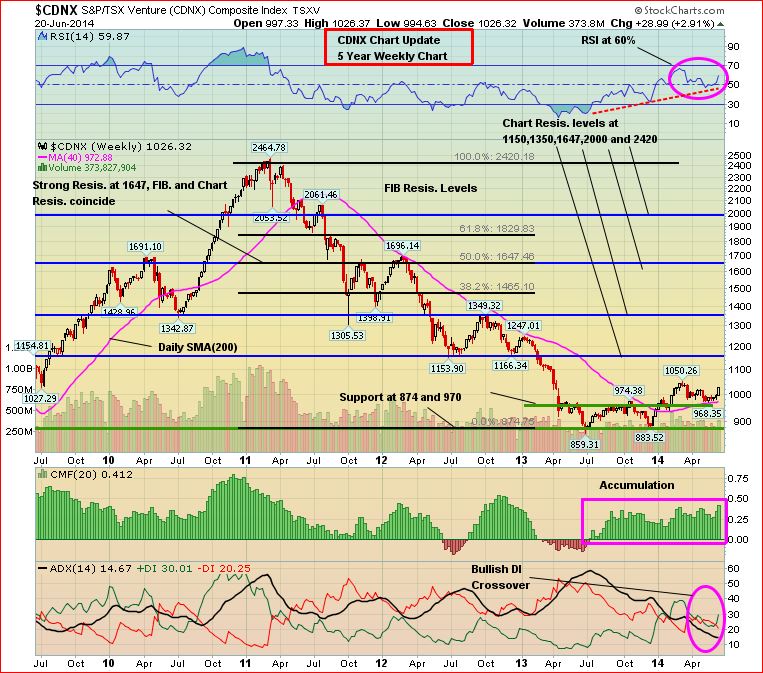
John’s long-term weekly chart shows 1150 – 1350 as a reasonable target range for the CDNX during the second half of the year (probably Q3).
It’s important to point out that RSI(14) on this 5-year weekly chart found a “comfort zone” in the immediate vicinity of the 50% level, as expected. A modestly overbought condition in the RSI(14) that emerged in March when the Index hit 1050 gradually unwound, with RSI(14) now on the upswing again at 60% (plenty of room to move higher). The recent decline that took the Venture to important support at 968 May 20 came on light volume, and accumulation (CMF indicator) remains steady and strong – the most extended period of healthy accumulation we’ve seen, actually, in a few years. This is a very bullish scenario, and includes a recent +DI/-DI crossover. The bears need to run and hide very quickly.

The Seeds Have Been Planted (And Continue To Be Planted) For The Next Big Run In Gold Stocks
There’s no better cure for low prices than low prices. The great benefit of the collapse in Gold prices in 2013 is that it forced producers (at least most of them) to start to become much more lean in terms of their cost structures. Producers, big and small, have started to make hard decisions in terms of costs, projects, and rationalizing their their overall operations. Exploration budgets among both producers and juniors have also been cut sharply. In addition, government policies across much of the globe are making it more difficult (sometimes impossible) for mining companies to carry out exploration or put Gold (or other) deposits into production, thanks to the ignorance of many politicians and the impact of radical and vocal environmentalists (technology has made it easier for groups opposing mining projects to organize and disseminate information, even in remote areas around the globe). Ultimately, all of these factors are going to create a supply problem – think about it, where are the next major Gold deposits going to come from? On top of that, grades have fallen significantly just over the past decade.
Gold
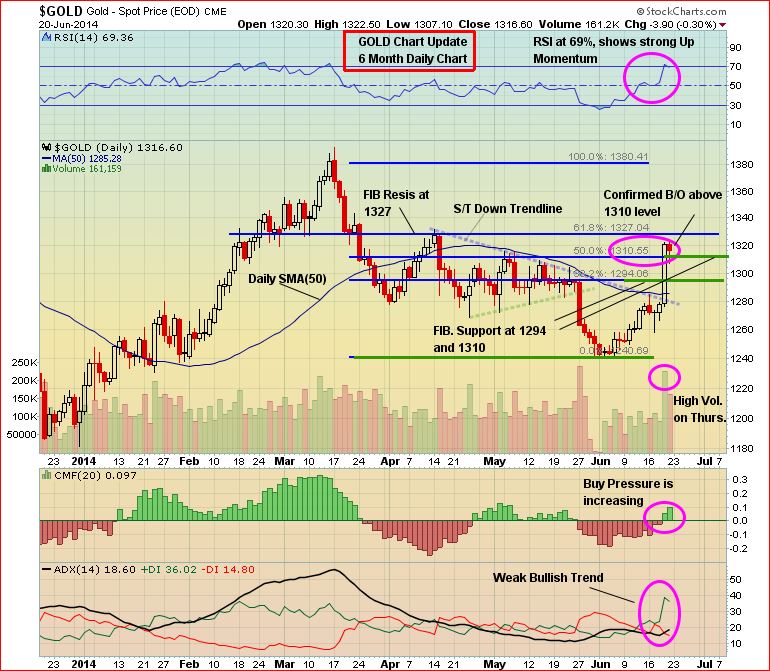
Gold put on a show last week, in particular Thursday following the Federal Reserve’s signal that it will stick with a near-zero interest rate policy to support the economy. This disappointed traders who had bet on hints of policy tightening. A lower U.S. 2014 growth forecast by the Fed and lingering geopolitical tensions in Iraq and Ukraine also helped to ignite Gold which pushed through important resistance in the $1,280’s.
Gold’s $39 advance last week to $1,315 came on the heels of a $24 jump the previous week, so the bulls have clearly put the bears on the defensive. The next important near-term Fib. resistance is $1,327 – a confirmed breakout above that area would be very significant. A strong support band now exists between $1,294 and $1,310.
Silver has staged an important breakout above a long-term downtrend line, and we’ll explore that situation in more detail Monday. Silver jumped $1.21 an ounce last week to finish at $20.88. Copper gained 7 cents to $3.10. Crude Oil retreated slightly to $106.83 while the U.S. Dollar Index lost one-fifth of a point to 80.33.
The “Big Picture” View Of Gold
As Frank Holmes so effectively illustrates at www.usfunds.com, the long-term bull market in Gold has been driven by both the Fear Trade and the Love Trade. The transfer of wealth from west to east, and the accumulation of wealth particularly in China and India, has had a huge impact on bullion. Despite Gold’s largest annual drop in three decades in 2013, the fundamental long-term case for the metal remains solidly intact – currency instability and an overall lack of confidence in fiat currencies, governments and world leaders in general, an environment of historically low interest rates, a Fed balance sheet now at $4 trillion and still expanding, money supply growth around the globe, massive government debt from the United States to Europe, central bank buying, flat mine supply, physical demand (especially from China), emerging market growth, geopolitical unrest and conflicts…the list goes on. However, deflationary concerns around the globe and the prospect of Fed tapering had a lot to do with Gold’s plunge during the spring of 2013 below the technically and psychologically important $1,500 level, along with the strong performance of equities which drew “momentum traders” away from bullion. The June 2013 low of $1,179 was likely the bottom for Gold. Extreme levels of bearishness emerged in the metal last year. With the long-term bull market remaining intact, we expect new all-time highs in Gold as the decade progresses. Inflationary pressures should eventually kick in around the globe after years of ultra-loose monetary policy.


6 Comments
hopefully ggi can continue its push upward next week
Jon, what are your views on copper. Do you think it will rise alongside gold and silver, or fall because of poor economic growth?
Copper has been holding up very well, Chris (superb support around $3), and it seems the Venture is signaling that all commodities, including Copper, are going to perform solidly in the coming months. China consumes 40% of the world’s Copper supply, so as long as economic growth remains steady there – if China can successfully implement important structural reforms while maintaining consistent GDP growth of 7% or better – then Copper should do just fine (that seems a likely scenario). We’ll update the Copper chart this coming week.
Like what I am reading and seeing developing here on the TSX Venture! It’s been a long 3.5 years! I can feel we are on the ‘cusp’ of breaking out during July 2014.
Jon, any updates on Alliance “ALM” ?
Haven’t followed it much the last year, Jim. Seems they’re trying to get something going in Arizona and as their rather lengthy and somewhat confusing NR stated the other day, they have “filed a plan of operation for exploration at the Gold Hill mine.” Their are better opportunities in this market IMHO.