TSX Venture Exchange and Gold
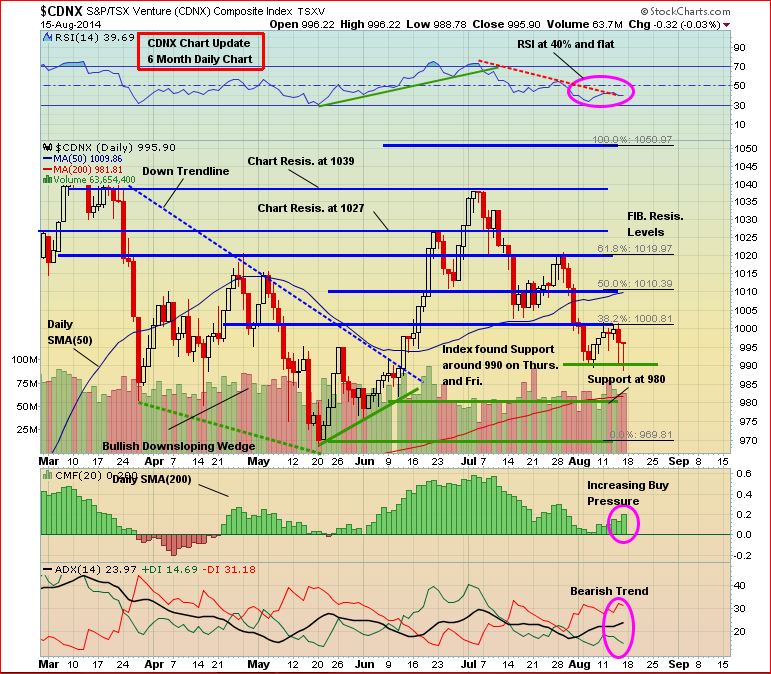
Over the last 9 sessions, the Venture has held in a tight trading range (on a closing basis) between 991.74 and 999.76. On Friday, the Index fell as low as 988.78 intra-day but recovered to finish the day off by just a fraction at 996 as Gold overcame early weakness and climbed back above $1,300 an ounce. The Venture finished down only 1 point for the week.
Here’s how we interpret the Venture’s current behavior: This very tight trading range, in the context of a bright overall technical picture which includes tremendous support in the immediate vicinity of a rising 200-day moving average (SMA) in the low 980’s, is equivalent to holding down a spring. When the spring is finally released, it moves with explosive force. When one weighs the probabilities of a breakdown vs. a breakout, the latter is infinitely more likely to occur in our view given a broad range of technical clues and the massive wall of support that has been constructed over many months in the 970-980 area in particular. In fact, when one also examines the TSX Gold Index, the possibility of a very sudden and dramatic spike in Gold stocks (and the Venture) in the coming weeks cannot be ruled out.
There are a couple of important indicators on this 6-month daily Venture chart that demonstrate how there’s more going at the moment than may appear to most investors who are just looking at the incremental daily moves, up or down.
Buy pressure as measured by the CMF has increased significantly in recent sessions after bottoming at the beginning of the month. RSI(14) also appears ready to break above a downtrend in place for more than a month. The 50 and 200-day SMA’s continue to rise. While this market has been like watching paint dry recently, this period is going to serve as a great example that patience is indeed a virtue.
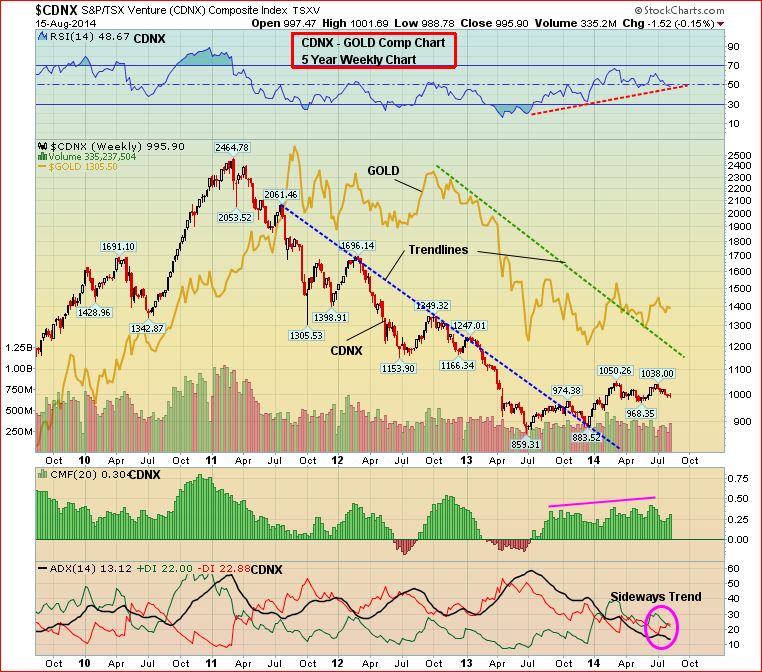
Venture 5-Year Weekly Chart
Understand the primary trend, key support and resistance areas, and stay focused on the “Big Picture” which remains very positive for the Venture. Below is the updated 5-year weekly chart with a Gold comparative. Note the string of higher lows the Venture has made since bottoming at 859 in June of last year.
RSI(14) on this 5-year weekly chart is once again testing the uptrend line (very healthy) around 50% which should continue to hold as support after serving as resistance since mid-2011 (major trend change). A modestly overbought condition in the RSI that emerged in March when the Index hit 1050 has gradually unwound to this new support.
The Q2 decline that took the Venture to superb support at 968 May 20 came on light volume, and accumulation (CMF indicator) remains steady and strong – the most extended period of healthy accumulation we’ve seen, actually, in a few years. This is a very bullish dynamic, and includes a recent +DI/-DI crossover. Those who gave up on this market during the 8% retreat from 1050 made a profound miscalculation. Astute investors have a great chance to cash in big over the next two to three months in particular before the possibility of a more substantial correction during Q4.
The Seeds Have Been Planted (And Continue To Be Planted) For The Next Big Run In Gold Stocks
There’s no better cure for low prices than low prices. The great benefit of the collapse in Gold prices in 2013 is that it forced producers (at least most of them) to start to become much more lean in terms of their cost structures. Producers, big and small, have started to make hard decisions in terms of costs, projects, and rationalizing their their overall operations. Exploration budgets among both producers and juniors have also been cut sharply. In addition, government policies across much of the globe are making it more difficult (sometimes impossible) for mining companies to carry out exploration or put Gold (or other) deposits into production, thanks to the ignorance of many politicians and the impact of radical and vocal environmentalists (technology has made it easier for groups opposing mining projects to organize and disseminate information, even in remote areas around the globe). Ultimately, all of these factors are going to create a supply problem – think about it, where are the next major Gold deposits going to come from? On top of that, grades have fallen significantly just over the past decade.
Gold
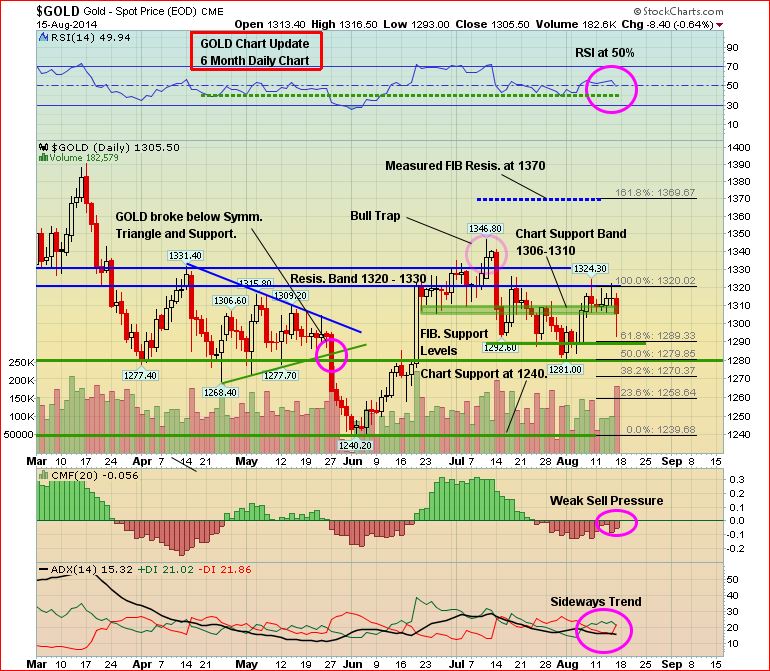
After holding in an extremely tight trading range Monday through Thursday, Gold prices suddenly fell more than $20 an ounce Friday before rebounding back above $1,300 on reports of a clash between Russian and Ukrainian forces in Ukraine. Bullion finished the week at $1,305, a decline of $4 an ounce from the previous Friday.
Much to the frustration of the bears, Gold is stubbornly holding important support around $1,280 despite strength in the U.S. dollar. Geopolitical tension appear to have put a strong floor underneath the price of Gold, and we’re also quickly approaching the traditionally bullish month of September when physical demand from Asia almost always kicks in.
A key resistance band exists between $1,320 and $1,330. A sustained breakout above that area is critical in order for Gold to gain serious traction.
The coming week brings two key events, the release of the most recent Federal Open Market Committee meeting minutes and the annual Fed confab at Jackson Hole, Wyoming. Fed Chair Janet Yellen will speak next Friday, and several other Fed presidents will also speak. The Jackson Hole conference will give the Fed a chance to update its views on the labor marke. Yellen is expected to reiterate her already-stated concerns about wages and continued slack in employment.
Silver fell 36 cents last week to close at $19.55 (John will have updated Silver charts tomorrow morning as usual). Copper fell 9 cents to finish at $3.13. Crude Oil jumped $1.77 a barrel Friday but still finished down slightly for the week at $97.35. The U.S. Dollar Index was relatively unchanged at 81.43.
The “Big Picture” View Of Gold
As Frank Holmes so effectively illustrates at www.usfunds.com, the long-term bull market in Gold has been driven by both the Fear Trade and the Love Trade. The transfer of wealth from west to east, and the accumulation of wealth particularly in China and India, has had a huge impact on bullion and will continue to support prices. Despite Gold’s largest annual drop in three decades in 2013, the fundamental long-term case for the metal remains solidly intact based on the following factors:
- Growing geopolitical tensions, fueled in part by a highly dangerous and expansionist Russia under Vladimir Putin, have put world security in the most precarious state since World War II;
- Weak leadership in the United States and Europe is emboldening enemies of the West;
- Currency instability and an overall lack of confidence in fiat currencies;
- Historically low interest rates, a Fed balance sheet at more than $4 trillion (still expanding), and money supply growth around the globe;
- Signs of increasing inflation;
- Continued strong accumulation of Gold by China which intends to back up its currency with bullion;
- Massive government debt from the United States to Europe;
- Continued net buying of Gold by central banks around the world;
- Flat mine supply and a sharp reduction in exploration and the number of major new discoveries.
Deflationary concerns around the globe and the prospect of Fed tapering had a lot to do with Gold’s plunge during the spring of 2013 below the technically and psychologically important $1,500 level, along with the strong performance of equities which drew “momentum traders” away from bullion. The June 2013 low of $1,179 was the bottom for Gold. Extreme levels of bearishness emerged in the metal last year. With the long-term bull market remaining intact, we expect new all-time highs in Gold as the decade progresses. Inflationary pressures should eventually kick in around the globe after years of ultra-loose monetary policy and the reluctance of central banks to increase interest rates.


