TSX Venture Exchange and Gold
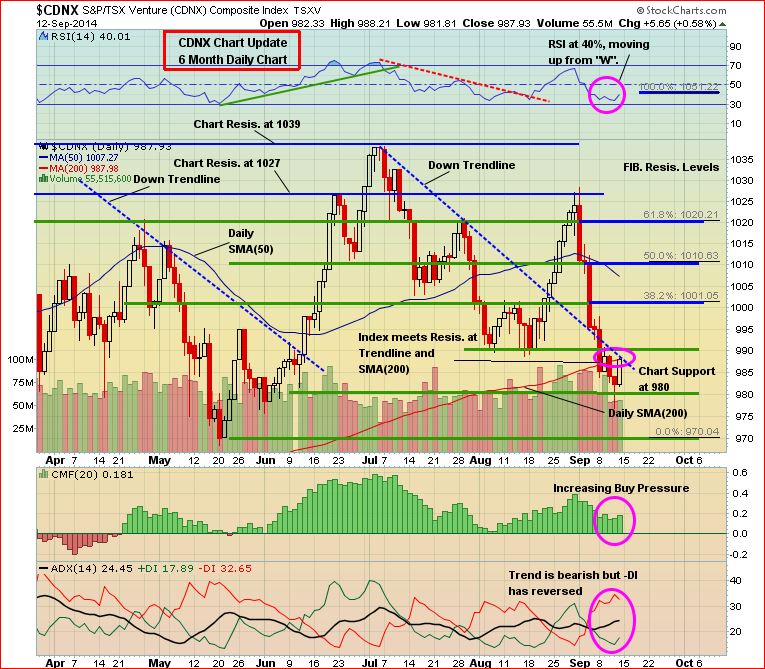
It was a rough week for commodities, including of course Gold which tumbled another $40, but encouragingly the Venture stabilized and even gained 6 points Friday while major equity markets declined and the yellow metal dropped below $1,240. For the week, the Venture was off 7 points to close at 988 (its 200-day moving average, and this SMA continues to rise which is important). Thursday, the Venture reversed after falling as low as 977 – within the band of exceptionally strong technical support between 970 and 980.
Further testing of that Great Wall of Support is certainly possible, but the regular charts we update for The Week In Review And A Look Ahead give every indication that this month could end differently than how it has played out so far. Fundamentally, potential catalysts could be a reversal in Gold and/or a much-needed new discovery somewhere – there’s nothing like a success story on the exploration front to give investors a jolt of confidence.
The 6-month daily Venture chart shows the formation of a bullish “W” in the RSI(14) which is a pattern often seen at a reversal point. In addition, buy pressure has started to increase again while -DI (ADX indicator) appears to have peaked. The rising 200 and 300-day SMA’s give us a level of comfort that the primary trend remains up.
Venture 5-Year Weekly Chart
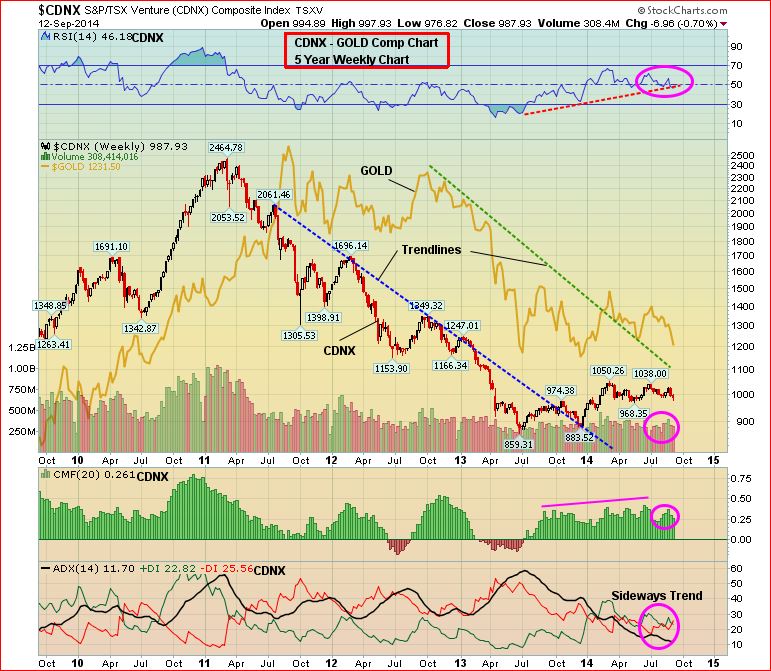
Despite a 36-point or 3.5% drop through the first half of this month, the Venture still remains well within the parameters of a primary uptrend as shown in this updated 5-year weekly chart. The Index has also been out-performing Gold which is a positive sign, a clear change in trend from the period beginning in early 2011 to mid-2013.
RSI(14) on this 5-year weekly chart is once again testing the uptrend line around 50% which has held as critical support after serving as resistance since mid-2011 (major trend change). A modestly overbought condition in the RSI that emerged in March when the Index hit 1050 gradually unwound to this new support. It’s very encouraging that despite the weakness during this first half of September, the RSI(14) uptrend line has not been violated.
The Q2 decline that took the Venture to superb support at 968 May 20 came on light volume, and accumulation (CMF indicator) has remained steady and strong since then. The Index has actually experienced the most extended period of healthy accumulation in a few years. This is a very bullish dynamic. While September has been disappointing to date, it’s quite possible we could see a sharp reversal over these last two weeks of the month and a much better than expected October.
The Seeds Have Been Planted (And Continue To Be Planted) For The Next Big Run In Gold Stocks
There’s no better cure for low prices than low prices. The great benefit of the collapse in Gold prices in 2013 is that it forced producers (at least most of them) to start to become much more lean in terms of their cost structures. Producers, big and small, have started to make hard decisions in terms of costs, projects, and rationalizing their their overall operations. Exploration budgets among both producers and juniors have also been cut sharply. In addition, government policies across much of the globe are making it more difficult (sometimes impossible) for mining companies to carry out exploration or put Gold (or other) deposits into production, thanks to the ignorance of many politicians and the impact of radical and vocal environmentalists (technology has made it easier for groups opposing mining projects to organize and disseminate information, even in remote areas around the globe). Ultimately, all of these factors are going to create a supply problem – think about it, where are the next major Gold deposits going to come from? On top of that, grades have fallen significantly just over the past decade.
Gold
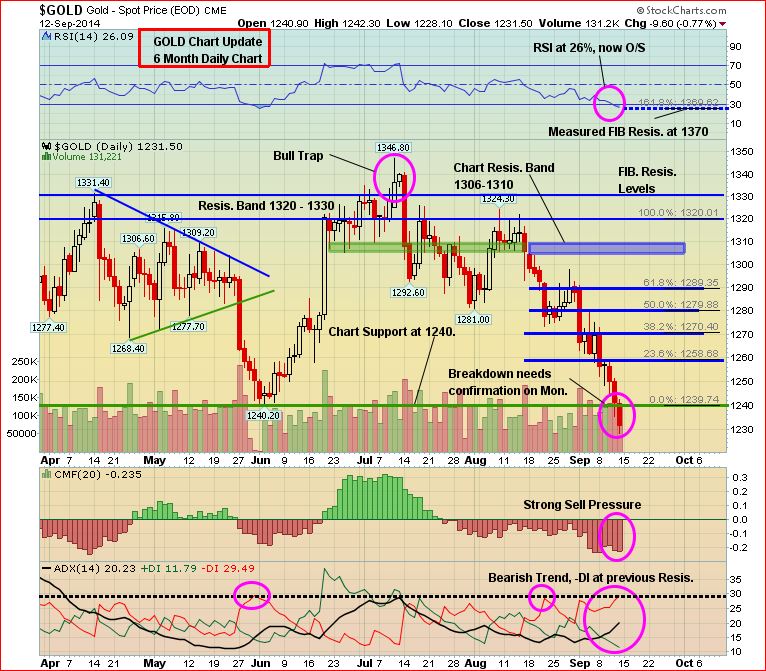
Continued strength in the greenback (the U.S. Dollar Index as risen for 9 straight weeks, the longest wining streak since 1997) put more pressure on Gold and commodities in general last week, with bullion dropping another $40 an ounce to $1,228. Short-term technical indicators are beginning to flash “overbought” for the U.S. Dollar Index and “oversold” for Gold, though a brief near-term test of the $1,200 support area for Gold certainly can’t be ruled out.
The prospect of more hawkish language from the Fed at its upcoming meeting Tuesday-Wednesday has been a major contributor to this weakness in Gold and strength in the dollar – a classic potential set-up for a “sell on news” scenario for the greenback this coming week. It’ll be very interesting to see what the Fed has to say and how traders react.
This 6-month daily Gold chart shows how oversold conditions are emerging in the RSI(14). We suspect commercial traders are in the process of significantly scaling back their short positions, given bullion’s $60 drop the last two weeks, which would be a bullish indicator – upcoming COT figures should provide valuable insight with regard to that.
Silver fell 58 cents last week to finish at $18.61. Copper gave up another 6 pennies, closing at $3.11. Crude Oil fell $1.02 a barrel to finish at $92.27 while the red-hot U.S. Dollar Index climbed nearly half a point to 83.76.
The “Big Picture” View Of Gold
As Frank Holmes so effectively illustrates at www.usfunds.com, the long-term bull market in Gold has been driven by both the Fear Trade and the Love Trade. The transfer of wealth from west to east, and the accumulation of wealth particularly in China and India, has had a huge impact on bullion and will continue to support prices. Despite Gold’s largest annual drop in three decades in 2013, the fundamental long-term case for the metal remains solidly intact based on the following factors:
- Growing geopolitical tensions, fueled in part by the ISIS terrorist group and a highly dangerous and expansionist Russia under Vladimir Putin, have put world security in the most precarious state since World War II;
- Weak leadership in the United States and Europe is emboldening enemies of the West;
- Currency instability and an overall lack of confidence in fiat currencies;
- Historically low interest rates
- Continued strong accumulation of Gold by China which intends to back up its currency with bullion;
- Massive government debt from the United States to Europe;
- Continued net buying of Gold by central banks around the world;
- Flat mine supply and a sharp reduction in exploration and the number of major new discoveries.
Deflationary concerns around the globe and the prospect of Fed tapering had a lot to do with Gold’s plunge during the spring of 2013 below the technically and psychologically important $1,500 level, along with the strong performance of equities which drew “momentum traders” away from bullion. The June 2013 low of $1,179 was the bottom for Gold in our view. Extreme levels of bearishness emerged in the metal last year. With the long-term bull market remaining intact, we expect new all-time highs in Gold as the decade progresses. Inflationary pressures should eventually kick in around the globe after years of ultra-loose monetary policy and the reluctance of central banks to increase interest rates.


6 Comments
New video and Fact Sheet on GGI website.
District-scale high-grade discovery at Rodadero North Silver-Gold Project in
central Sonora State – Phase II drilling in progress
! Exceptional targets outlined for upcoming first-ever drilling at Grizzly Project
! Attractive share structure – no warrants, no major financings since 2009 – and
strong working capital position
! Synergistic mix of business, market & geological expertise
!
v.fnc new corporate presentation;
Thanks for the heads up Dan. I like the word ”exceptional” when they refer to the Grizzly. They are very bullish and confident about this area. I hope they are proved right when the drill turns and we get results. Could be a nice Christmas present for us.
Will this be a game-changing week coming up for the entire Sheslay district? I believe it will be. Also, keep an eye on BLO. It’s revving up and more U.S. investors are discovering this which is key.
I think the Sheslay could erupt this week as we just got a taste of DBV/AIX/ABR/PGX starting to churn some volume!
Sheslay has certainly been hot this last week, but I’m still confused as to why some Sheslay plays are moving and
others are dead in the water. DBV, GGI, PGX moved nicely. VMI, AXI and ABR also saw great volume and had a nice pop. However,
RG (Romios Gold) has not even moved in the slightest; I don’t know much about the company but back in Feb 2014 they
doubled their land holdings to “6,239 hectares (15,417 acres) is over airborne magnetic anomalies which resemble the geophysical anomaly covered by the Hat Property where Doubleview Capital Corp announced that it had recently drilled 0.32 per cent copper equivalent over 313.11 metres”. Judging from the land holdings map of the Sheslay the Romios property is literally butted up against the north / north east side of AIX, DBV and GGI. …. but no one seems to care?