TSX Venture Exchange and Gold & Silver
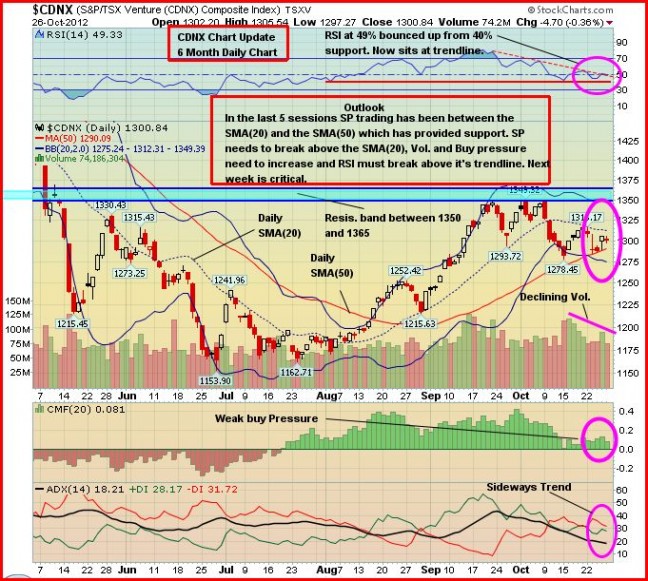
The Venture has held up extremely well this month despite a $100 correction in the price of Gold and weakness in the U.S. equity markets. For the month, after Friday’s close at 1301, the Venture is down just 34 points or 2.5% which compares to a 2.5% drop in the Dow, a 4% pullback in the Nasdaq, and a 3.7% correction in the TSX Gold Index. Interestingly, the TSX is essentially unchanged for the month so far, down just 17 points.
The Venture’s rising 50-day moving average (SMA) is providing support just above 1290 (the intra-day low last week was 1285 on Tuesday) and the 100-day SMA has flattened out over the past month and appears poised to start rising over the final two months of the year – that’s definitely a positive sign and points to a better November after a period of consolidation in October.
Below is a 6-month daily chart from John. What we need to keep an eye on in the coming days is the RSI(14) and whether or not it can break above the down trendline (this has just occurred in Gold). Volume and buying pressure both need to increase. The Venture is almost exactly in the middle of a range that features a band of resistance between 1350 and 1365, and very strong support around 1250. Our belief is that there’s a greater probability of a breakout to the upside before year-end, positioning the Index for a powerful first quarter of 2013. The recent reversal to the upside in the 1,000-day SMA, after a four-year decline, helps support this view.
Another takeover last week (Hana Mining, HMG, TSX-V) was cheered by investors and further underscores that there are great values in this current market. For the week, HMG was up 76%.
The Venture lost 15 points for the week but closed 16 points above its weekly low. It’s quite possible we could see more “churning” until the U.S. elections November 6.
Gold
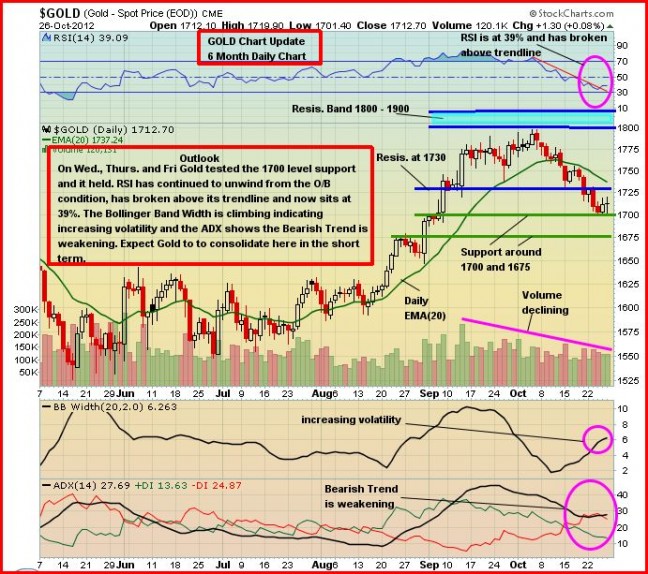
Gold has been going through a very steady, orderly and healthy correction this month to unwind an overbought condition that became very evident in September as bullion met resistance at $1,800 an ounce. Gold closed Friday at $1,711, a $9 loss for the week after previous weekly setbacks of $34 and $27, respectively.
A couple of interesting technical points regarding Gold: 1) Strong support at $1,700 held last week, and this resulted in some short covering by traders; 2) RSI(14), as shown in John’s 6-month daily chart below, appeared to find support and has broken above a down trendline; 3) Increased near-term volatility is likely, given the climbing Bollinger Band Width; 4) the ADX indicator shows that the recent bearish trend is weakening.
The above bullish indicators contrast with a somewhat bearish COT structure that shows commercials still holding significant short positions, though there was some trimming back of short positions last week. However, over the last decade, November has been Gold’s best month of the year. In addition, the Hindu festival of lights, Diwali, begins next month and traditionally that brings in plenty of physical buying into the market.
The suddenly up-in-the-air U.S. Presidential election has created some confusion among many traders and investors in all markets, Gold included. Generally, an Obama victory is viewed by most analysts as being more favorable for Gold and bearish for the U.S. dollar though the possibility of four more years of this president at the helm should scare people more than anything else this Halloween. Mitt Romney, on the other hand, seems to go in whatever direction the wind is blowing. True leadership is missing in Washington, and ultimately that has to be considered bullish for Gold as the safe-haven ultimate currency.
Silver was up slightly for the week, 7 cents to $32.09. Copper fell 8 pennies to $3.54. Crude Oil declined $3.72 to $86.28 while the U.S. Dollar Index gained just over one-third of a point to close the week exactly at 80. The Dollar Index is being pressured by a falling 50-day SMA at 80.18 and a declining 200-day SMA at 80.64.
The “Big Picture” View Of Gold
As Frank Holmes so effectively illustrates at www.usfunds.com, Gold is being driven by both the Fear Trade and the Love Trade. The transfer of wealth from west to east, and the accumulation of wealth particularly in China and India, is having a huge impact on Gold.
The fundamental case for Gold remains incredibly strong – currency instability and an overall lack of confidence in fiat currencies, governments and world leaders in general, an environment of historically low interest rates and negative real interest rates that won’t end anytime soon (inflation is greater than the nominal interest rate even in parts of the world where rates are increasing), money supply growth, massive government debt from the United States to Europe, central bank buying, flat mine supply, physical demand, investment demand, emerging market growth, geopolitical unrest and conflicts, and inflation concerns…the list goes on. QE3 has arrived, and massive central bank intervention is now taking place to prevent a breakup of the euro zone and to kick-start the global economy. It’s hard to imagine Gold not performing well in this environment.


9 Comments
Hi Jon,
Any explanation for the RJX.A sell off last Friday?
It continues to trade in a range. Geologically, the appeal of RJK is that it has prime land in one of the best gold districts in the country right now, and they’re drilling. So we expect it’s just a matter of time before something happens, either a hit by RJK, a hit by another company or companies, or more takeovers by New Gold. Undeniably an issue with RJK is Pinetree’s (Sheldon’s) share position, and he’s been selling some RJK (and other stocks) to raise cash. Not huge amounts of RJK but enough to keep a lid on the share price until there’s an event that overcomes that. So we suspect RJK will continue to bounce around a little, and the support and resistance levels at the moment are pretty clear. As always, patience is the key. Keep in mind, Friday was month-end settlement. Some of the selling in RJK could have been related to that (Pinetree) to square up accounts.
Huge week for RBW this week IMO. chart is ready for a breakout…but will it be up or down? as we move through the week with assays pending we will soon see what International has in store for Rainbows shareholders…
My sixth sense forecast for this week:
RBW.. Low 21 cents High 55 cents, Close at 49 cents **
GQC.. Low $0.79, High $0.92, Close at $0.83
GBB.. Low 10 cents, High 12 cents, Close at 12 cents **
EVR.. Low 7.5 cents, High 8.5 cents, Close at 8 cents
SFF.. Low 14 cents, High 15.5 cents, Close at 15.5 cents **
SF .. Low 2 cents, High 2 cents, Close at 2 cents **
TYP.. Low 15 cents, High 17 cents, Close at 17 cents**
NAR.. Low 4 cents, High 4.5 cents, Close at 4 cents **
** hold a portfolio
Gents from BMR,
Can you offer your opinion on ABI? Volume was relatively high on Friday and with the PEA due Nov. 1 this must read as positive?
Theo why so bullish on rbw? Hope yer right!
Frankly speaking, my RBW sell lot is set at 55 cents … we are all waiting for that day!
Take a look at this SPP.V chart BMR and others…
http://stockcharts.com/h-sc/ui?s=SPP.V&p=D&b=5&g=0&id=p14905446172
Jeb Handwerger has a 1 dollar target for rbw but .55 sounds good too!