TSX Venture Exchange and Gold
The Venture continues to fight resistance around the 1240 level, but this overall base-building going back to June of last year is the type of activity that typically precedes an eventual major breakout to the upside. As we’ve stated repeatedly, investor patience with this very “slow moving train” is critical. It’s interesting to note, in John’s 7-month chart below, that the CMF indicator (Chaiken Money Flow), has shown positive buying pressure in the Venture since the second half of July. So there has been consistent accumulation in this market by some investors who are obviously expecting a turnaround in 2013. Sentiment toward the juniors is as poor now as it was bullish to the extreme in late 2010 and early 2011. It generally wasn’t a good time to be a buyer back then, just like we believe it’s not a good time to be a seller right now – especially of the better quality juniors with strong management that either have proven valuable resources in the ground or an excellent chance at a significant discovery. In this business, strangely enough, many investors act the opposite to how they shop for their everyday needs and desires. They’ll line up outside a store for a few hours to get a bargain on electronics, but they’ll be first in line to sell a stock at fire sale prices out of fear when they really should be buying. Go figure. The market is definitely a great way to study human psychology and behavior.
The Venture traded as high as 1245 Wednesday before being driven back down to support at 1220 intra-day Friday. Not surprisingly, it bounced off this support to close Friday at 1227, an 8-point loss for the week. What we’re seeing at the moment, then, is basing between 1220 and 1240. The 50-day moving average (SMA) has flattened out around 1215 and a reversal to the upside in the 50-day would be a key factor in giving this market fresh technical momentum, so that is something to watch for in the coming days or over the next few weeks. A breakout through 1240 this coming week, should it occur, would trigger that reversal in the 50-day SMA.
Gold
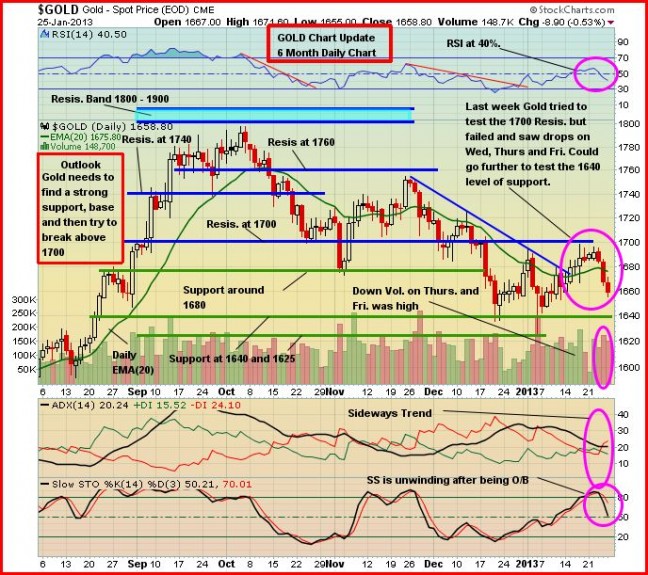
It was a rough week for Gold as the yellow metal plunged $28 an ounce to $1,659, selling that was perhaps out of traders’ frustration as Gold once again encountered stiff resistance at $1,700. Meanwhile, the assets of the Federal Reserve’s balance sheet have broken through $3 trillion, hitting new highs. Money printing around the globe is in full swing but Gold isn’t responding in the way that some believe it should. Below is a 6-month daily chart from John. While there’s plenty of overhead resistance, there’s also strong support around $1,640.
Silver fell 71 cents for the week to $31.18. Copper was flat at $3.64. Crude Oil climbed another 32 vcents to $95.88 while the U.S. Dollar Index slid one-third of a point to 79.74.
As usual, we’ll be posting John’s short-term and long-term Silver charts Monday morning.
The “Big Picture” View Of Gold
As Frank Holmes so effectively illustrates at www.usfunds.com, Gold is being driven by both the Fear Trade and the Love Trade. The transfer of wealth from west to east, and the accumulation of wealth particularly in China and India, is having a huge impact on Gold.
The fundamental case for Gold remains incredibly strong – currency instability and an overall lack of confidence in fiat currencies, governments and world leaders in general, an environment of historically low interest rates and negative real interest rates that won’t end anytime soon (inflation is greater than the nominal interest rate even in parts of the world where rates are increasing), money supply growth, massive government debt from the United States to Europe, central bank buying, flat mine supply, physical demand, investment demand, emerging market growth, geopolitical unrest and conflicts, and inflation concerns…the list goes on. QE3 has arrived, and massive central bank intervention is now taking place to keep the euro zone intact and to kick-start the global economy. It’s hard to imagine Gold not performing well in this environment.


