TSX Venture Exchange and Gold
The Venture Exchange suffered its 10th straight weekly decline thanks to Friday’s 26-point loss as Gold was hammered below $1,500 an ounce. At 1023, the Venture is down 16.8% over the last 10 weeks vs. a 23.6% drop in the TSX Gold Index and an 11.5% fall ($191) in the price of Gold. Since late January the Venture has traded below its 10-day moving average (SMA). Any minor relief rallies have stalled at the 10-day, and that trend is likely to continue over the near-term. It’s impossible to say where the bottom will be, but the Venture in our view is going to be hard-pressed to hold support around 1000 as Gold may ultimately have to drop another 10% or so before it finally hits a cycle low after failure of critical support in the $1,500’s. Keep in mind, however, that it’s during periods like this when investors with a longer-term perspective can plant the seeds that deliver fantastic returns over the next few years when the bull market comes roaring back. And it will.
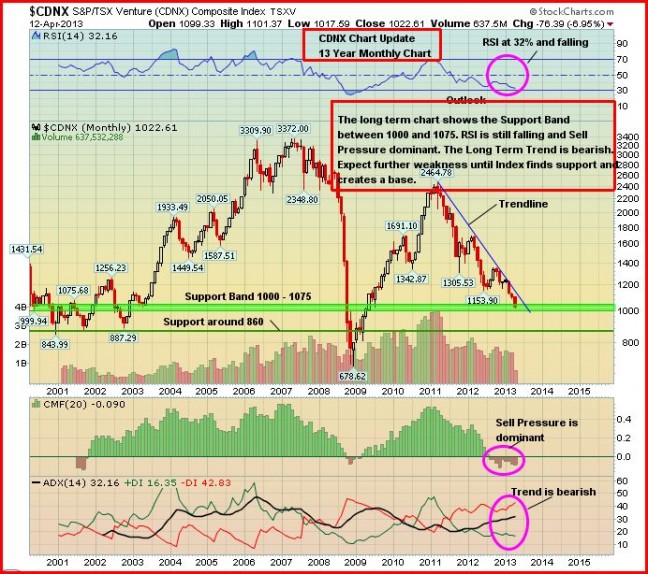
Below is a 13-year monthly CDNX chart. RSI(14), at 32%, continues to fall but is drawing closer to its 2008 Crash low. The down trendline is clear. Selling pressure is dominant. There is support at and just below 1000, but the next major support is around 860. At a time when the Dow and S&P 500 are both at all-time highs, and when Gold is still very close to a respectable $1,500, the extent of the slide in the junior resource market has been difficult for many investors to comprehend. Not only have share prices taken a beating, but Venture financings in March were only a quarter of what they were (in total value) 2 years ago. The regulatory environment, increased jurisdictional risks around the globe, and too many poorly run companies have all contributed to the Venture’s woes, in addition of course to the correction in Gold and weakness in many commodities in general. But this is really the best time – during an atmosphere of despair and negativity – to be searching for diamonds in the rough that have the potential to become market leaders when conditions do improve.
Gold
From new record highs in the Dow and the S&P, to another bearish call on Gold by Goldman Sachs, to the likelihood of Cyprus having to sell most of its Gold (which financial basket case country might be next?), to general chart deterioration, there were several factors that contributed to bullion’s “moment of decision” Friday as it lost a whopping $84 an ounce to close at $1,477. Bears have shown unequivocally that they are firmly in control of this market at the moment – the close below critical support levels at $1,550 and $1,500 is a clear indication of that. Quite simply, Gold has enjoyed a spectacular run over the last dozen years, climbing more than six-fold from below $300 an ounce, and it has gotten tired.
We remain convinced, however, that the long-term bull market in Gold is still intact. It’s important to note that most bull market cycles in any commodity or asset class typically experience several corrections of at least 30%. In fact, Gold corrected 29% just five years ago before quickly bouncing back. During the 1970’s bull market, Gold fell 47% before rising 8 times to peak at $800 an ounce. Commodity bull markets have averaged 18 years over the past century with 14 years as a minimum. We’re now in the 13th year of this Gold bull market, and no doubt this correction is laying the foundation for another dramatic move to the upside. And it doesn’t take a rocket scientist to figure out what happens when supply is removed from the market. Many Gold projects have been, and will continue to be, put on hold as they are simply not economical at a Gold price of $1,300. Exploration is being cut back dramatically and this will limit the discovery of new deposits.
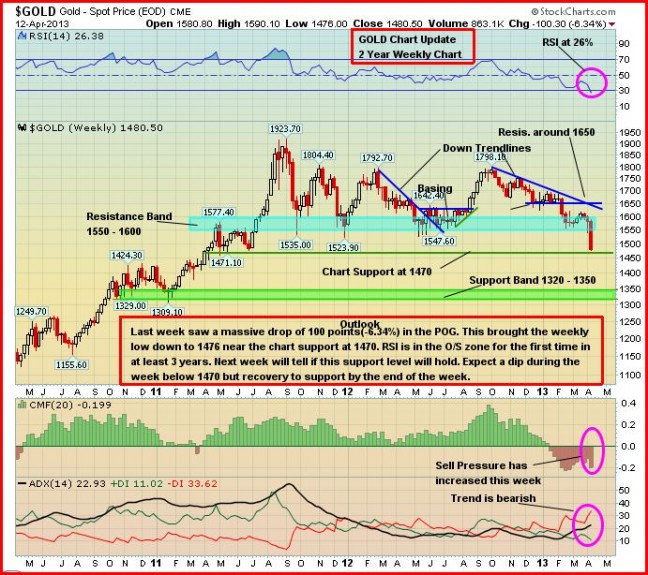
The first bearish technical development for Gold last week was when it couldn’t bust through resistance at $1,590 early in the week. It managed to hold support on a closing basis at $1,550 until Friday when the bears were finally able to deliver a knock-out punch. The breach of support at both $1,550 and $1,500 means we should expect further weakness going forward with the $1,500 to $1,600 area providing very stiff resistance on any rallies. While Gold could find support between about $1,450 and $1,470 over the near-term, especially as some short-covering takes place, the likelihood of another 10% drop into the low $1,300’s has to be considered highly likely. This would be about a 30% correction from the September 2011 high.
Below is a 2-year weekly chart from John. Expect a further drop in RSI(14) before it finally bottoms out.
Silver tumbled $2.45 last week to close at $25.85 (John will have updated Silver charts Monday morning). Copper lost a penny for the week, finishing at $3.35. Crude Oil’s weakness continued as it fell $1.41 a barrel to $91.29 while the U.S. Dollar Index fell Friday, despite the huge loss in Gold, and closed the week down nearly half a point to 82.13.
The “Big Picture” View Of Gold
As Frank Holmes so effectively illustrates at www.usfunds.com, the long-term bull market in Gold has been driven by both the Fear Trade and the Love Trade. The transfer of wealth from west to east, and the accumulation of wealth particularly in China and India, has had a huge impact on bullion. Despite the current price correction, the fundamental case for Gold remains incredibly strong – currency instability and an overall lack of confidence in fiat currencies, governments and world leaders in general, an environment of historically low interest rates and negative real interest rates that won’t end anytime soon (inflation is greater than the nominal interest rate even in parts of the world where rates are increasing), a Fed balance sheet now in excess of $3 trillion and expanding at $85 billion a month, money supply growth around the globe, massive government debt from the United States to Europe, central bank buying, flat mine supply, physical demand, emerging market growth, geopolitical unrest and conflicts…the list goes on. Investment demand and inflation concerns have waned recently, contributing to Gold’s decline, but they could figure prominently again in the future. There are many reasons to believe that Gold’s long-term bull market is still intact despite a 20%+ correction from the 2011 all-time high of just above $1,900 an ounce.


3 Comments
I think some people are saying, 1450-1475 range….others say the 1433…..others, like bmr, are saying 1300+, so if everyone is going in one direction, don’t you go the other contrarian? Let’s just get it done quickly and move forward from there?
Jon I have a dumb question for you. Always hear these terms bears and bulls and wondering when you say bears finally have knock out punch exactly what is meant. I’m wondering who or what these bears really are, or is it just a figure if speech to explain current overall market conditions? Or us there actually a group of azzclowns sitting behind their computers manipulating things to push it down. If you are not shorting something then why would you want to push it down?
well who would of thought that the cdnx would even be in 3 digit territory…. I thought it… didnt believe it.. was looking for reasons and fundamentals to disbelieve it.
I was told I was nuts…. sorry to say… guess I am nuttier than most…
the community of soothsayers has been cut off at the knees… including Sinclair… was at the seminar last week… all sounded good… was a troop rally cry knowing what was coming??
the community makes me puke…. they are in it for themselves and noone else.. present company excluded…. ad dont get me started om regulators..
we dont stand a chance… not a snowballs chance in he&&…. wheres the fork?