TSX Venture Exchange, Gold & Commodities
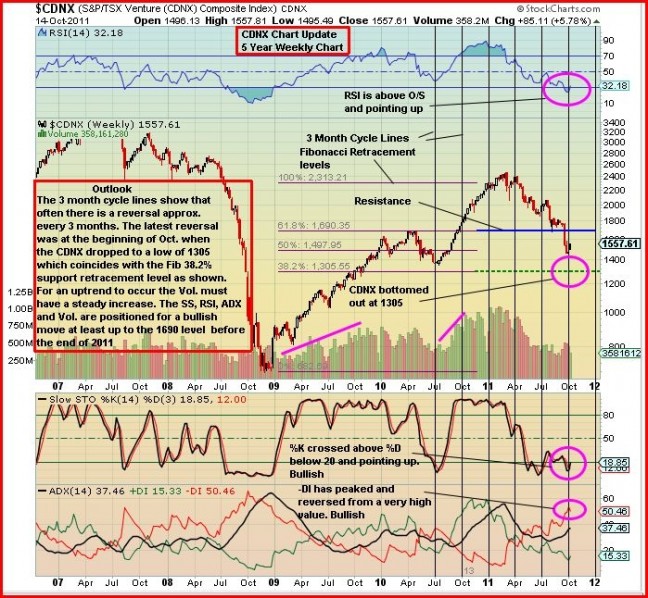
Markets powered higher again last week and the CDNX, after hitting a low of 1306 October 4, shot through resistance around 1530 to close Friday at the day’s high of 1558. That represents a whopping gain of 19% over just eight sessions, though volume in this move has been unimpressive. A 20% jump in such a short period during a real bull market would have looked very different in terms of the performance of certain individual stocks. What has happened since October 4 is that a lot of stocks have just bounced off their lows, which is simply one reason we still consider this nothing more than a bear market rally.
The weekly gain for the CDNX was 5.8%, in line with weekly gains in the TSX (4.3%), the Dow (4.9%), the Nasdaq (7.6%) and the S&P (5.9%). So where to from here?
John’s latest CDNX chart, posted earlier today, makes a strong case for a move to 1700 on the CDNX. There is significant resistance at 1600 and major resistance just below 1700 (we have re-posted the chart below). One possible scenario is that this market will initially push higher next week, stall or react around 1600, pull back 5% or so, and then make a run to 1700. But that’s simply an educated guess. It’s reasonable to expect a pullback in the coming days and then a resumption of the rally.
The problem for the CDNX is that, baring an unexpected explosion to the upside, this market has suffered some major technical damage over the last couple of months and it seems almost inevitable that the critical 300-day moving average (SMA) will reverse to the downside by the end of the year. With the 100, 200 and 1,000-day moving averages currently in decline, and very little hope of any reversal in those SMA’s over the next several months, a declining 300-day will confirm the bear’s victory over the bull. Over the last six months there have been many deceiving rallies in the CDNX which is typical of a bear market. And that’s why it’s so important to be careful now.
As we have stated many times in the past, the CDNX has proven to be an incredibly reliable leading indicator of the broader markets and even the global economy. Year-to-date, the CDNX is off 32%. The Dow and Nasdaq are both up just over one-half of 1% for the year (in positive territory again), the S&P is down 2.63% while the TSX is off 10% for the year. The CDNX led the markets higher in the third and fourth quarters of last year. It has significantly under-performed the broader markets for most of this year and we believe that indicates big trouble for the beginning of 2012. The good news is, we all have a bit of time to prepare for the coming downwave.
Given the current “big picture” environment and the overall technical condition of the CDNX, chasing penny stocks at the moment involves an unusually high degree of risk. Our approach will continue to be a cautious one but in the coming weeks we’ll be putting forth ideas and potential strategies to deal with what could be on the horizon beginning later this quarter or the beginning of 2012. If there’s going to be a market meltdown, it’s important to be ready to profit handsomely from it.
Exposure to Gold through physical ownership of the yellow metal or through Gold producers and quality near-term producers continues to make a lot of sense.
Gold & Commodities
Gold enjoyed a positive week, closing at $1,680, as it continues to flirt with the $1,685 resistance level. Our near-term outlook, based on John’s most recent chart, weighs more to the bullish side. The next major resistance after $1,685 is in the mid-$1,750’s.
The U.S. Dollar Index (76.61) has weakened, which is bullish for Gold, while there are encouraging signs in Silver as well which closed Friday at $32.16. Copper finished the week at $3.41 while Crude Oil also firmed up, closing at $86.80.
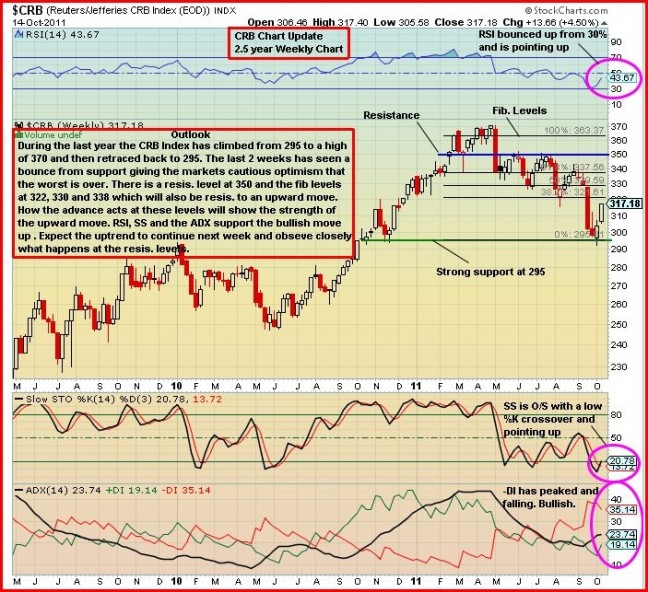
The technical behavior of the CRB Index (John updates the CRB chart below) gives additional credence to the argument that commodities and the CDNX do have higher to go over the short-term.
The “Big Picture” View Of Gold
As Frank Holmes so effectively illustrates at www.usfunds.com, Gold is being driven by both the Fear Trade and the Love Trade. The transfer of wealth from west to east, and the accumulation of wealth particularly in China and India, is having a huge impact on Gold.
The fundamental case for Gold remains incredibly strong – currency instability and an overall lack of confidence in fiat currencies, governments and world leaders in general, an environment of historically low interest rates and negative real interest rates (inflation is greater than the nominal interest rate even in parts of the world where rates are increasing), massive government debt from the United States to Europe, central bank buying, flat mine supply, physical demand, investment demand, emerging market growth, geopolitical unrest and conflicts, and inflation concerns…the list goes on. It’s hard to imagine Gold not performing well in this environment. The Middle East is being turned on its head and that could ultimately have major positive consequences for Gold.
What’s also driving Gold is the weakness of the United States, brought on in no small part by one of the most ineffectual Presidents the nation has ever been saddled with. America has lost its way and the recent S&P downgrade is both a real and a symbolic reflection of that. Since the summer of 2009, the U.S. economy has produced a net total of just two million jobs while federal spending has gone through the roof. Throughout its incredible history, the United States has demonstrated an amazing resiliency and the ability to bounce back from major economic, social and political troubles. It will do so again but this will take time and a real Commander-in-Chief in the White House by November, 2012. By then Gold will have climbed another 50% or more.


4 Comments
If there is going to be a major market meltdown, I think USD would rise and gold would fall along with other stuffs (which was evident during late September).
John: with the CRB chart, I’m wondering what kind result you would get if you put the beginning of fibonacci around 2010 June/July low (around 250ish) as the rally during 2H 2010 was driven by the QE2.
I am getting a bit annoyed by your ongoing criticism of President Obama. He inherited one hell of a mess from his predecessor and it’s going to take time to get out of his messes. Since Obama should (IMO) be moving faster to get out of these messes he may be ineffectual as you say, but he is not the one who created the messes and I think it is important to make that distinction. Who is the worst President in the history of the U.S? Hint: It isn’t Obama.
Fair enough, Dan – no one denies he inherited a mess, but this is not a President who has a real grasp of how a private sector economy needs to function. He is also now contributing to class warfare. But from an individual who was taught Black Marxist Theology by Jeremiah Wright for 20 years, this shouldn’t come as a surprise.
Bruce
A CRB chart will be posted later this evening.