
Gold has traded between $1,310 and $1,319 so far today…as of 8:15 am Pacific, bullion is up $1 an ounce at $1,316…Silver is off 8 cents at $20.79…Copper is up a penny at $3.17…Crude Oil has retreated 37 cents to $105.37 while the U.S. Dollar Index has tumbled one-quarter of a point to 79.81…this is a shortened trading week…there will be no Morning Mornings tomorrow as we celebrate Canada Day (all Canadian markets are closed)…regular postings resume Wednesday through the end of the week, but keep in mind that Thursday is only a half day on U.S. markets while all U.S. markets are closed Friday of course in observance of the Fourth of July…
 Interestingly, Gold is now trading above its 10, 20, 50, 100 and 200-day moving averages (SMA’s)…bullion is headed for its second straight quarterly increase, the first time it has posted back-to-back quarterly gains since 2011…
Holdings in the SPDR Gold Trust, the biggest bullion-backed exchange-traded product, stood unchanged at 785.02 tons on Friday, according to data compiled by Bloomberg…assets are set to decrease this quarter and have dropped 1.7% this year…selling is clearly drying up and that’s a very positive sign…
What to make of this?…data released after the close on Friday showed hedge funds and other large Gold investors adding a record amount of ounces to their bullish positions…according to Commodity Futures Trading Commission data, bearish or short positions held by so-called “managed” money fell by nearly 25,000 contracts in the week to June 24…speculators added almost the same number of bullish or long positions, translating into a 61% net gain of 47,784 contracts or 4.8 million ounces – the biggest weekly increase since 2007, and apparently one of the largest increases on record…managed money appears to be anticipating an upside summer move in Gold, and that makes perfect sense, but as John’s chart showed yesterday the Gold market likely needs to digest recent gains and that means some immediate or near-term consolidation and testing of support prior to a potential strong move through important resistance…
Same applies to Silver which has gotten ahead of itself a little bit with a powerful June…managed money moved heavily into Silver in the week ending June 24 with net longs increasing almost four-fold by 19,623 contracts to 24,757, almost equaling the February high of 25,090 contracts, CFTC data shows…commercials really ramped up their short positions, however, and what that tells us is that Silver is headed for some mild consolidation at the beginning of Q3 before pushing higher again…John has three updated Silver charts at the bottom of today’s Morning Musings…
Today’s Equity Markets
Asia
China’s Shanghai Composite added 12 points overnight to finish the quarter at 2048…both the government’s official Purchasing Managers’ Index (PMI) for June and HSBC’s final PMI reading are due for release tomorrow…positive industrial production figures for May gave Japan’s Nikkei average a 67-point boost to finish at 15162…
Europe
European markets were mixed today…euro zone inflation came in at 0.5% year-on-year in June, unchanged from May…the reading comes ahead of an ECB meeting later this week…falling inflation has been a key concern for the central bank, due to fears it could derail the region’s recovery…
North America
The Dow is off 25 points as of 8:15 am Pacific…the major economic data this week will be Thursday’s jobs report from the Labor Department…expectations are for non-farm payroll growth of 215,000 jobs, consistent with recent results…the ISM Manufacturing Index will be out tomorrow…as we mentioned at the top, U.S. markets are open for just half a day on Thursday and closed Friday to celebrate the Fourth of July…
The TSX has gained 28 points while the Venture is off 2 points at 1021 as of 8:15 am Pacific…
The Venture has out-performed both the Dow and Gold during this second quarter with today of course the final day of Q2…we’re looking for an acceleration of a bullish Venture trend in Q3 with the Index breaking out above the mid-March high of 1050 and testing the next major resistance around 1150…within that environment, the highest quality and most active juniors with attractive share structures and discoveries in the making (i.e., Garibaldi Resources, GGI, TSX-V, and a host of others we’ve been mentioning) could perform incredibly well…
Second Quarter Gains Entering Final Trading Day of June
TSX Gold Index 6.6%
Silver 5.7%
TSX 5.3%
S&P 500 4.7%
Nasdaq 4.7%
Venture 2.8%
Dow 2.4%
Gold 2.3%
Venture-Gold Comparative
Over the past year, there has been an important pattern change in the relationship between the Venture Exchange and Gold…historically, the Venture has proven to be an exceedingly reliable leading indicator of the future direction of Gold prices – a great recent example being the Venture’s breakdown months before Gold peaked at just over $1,900 an ounce in September, 2011…this leading indicator pattern goes right back to the days of the Venture’s predecessor, the old Vancouver Stock Exchange…
Since late last year, we’ve repeatedly shown charts – a plethora of technical evidence – demonstrating that the Venture bear market ended in late June of last year when the Index touched 859…in October, the Index broke above a long-term downtrend line and then repeatedly tested that downtrend line as new support until late December when it finally took the path of least resistance and headed north…after hitting some headwinds at 1050 in mid-March, the Venture – not unexpectedly – retreated to a “comfort zone” where it successfully tested a very strong support band in the immediate vicinity of 970 which was critical resistance for many months last year…
The second quarter has seen a continuation of the trend with the Venture out-performing Gold…this updated 10-year monthly chart from John shows how the Venture’s out-performance vs. Gold is a bullish indicator for both…on the chart below, you’ll see three uptrend lines – one that’s currently in progress – and two downtrend lines…
The best time to be invested in the Venture (and Gold for that matter) is when the Index (the black line on this chart) is out-performing the yellow metal as it is now (staying at or above the red uptrend line)…this Venture uptrend vs. Gold has been established since the second quarter of last year and should continue for an extended period, during which time we also expect Gold to ultimately reverse higher…

West Point Resources (BLO, CSE) Update
We mentioned West Point (BLO, CSE) last Thursday during its first day of trading on the CSE, and the stock didn’t disappoint in its market debut as a leader in an important and needed technology that could benefit immensely from the growing acceptance and use of cannabis, for medicinal and other reasons, in North America…
BLO, which switched from the Venture to the CSE following a change of business, opened in the mid-teens last Thursday and climbed as high as 24.5 cents intra-day Friday before closing the week at 21.5 cents…it has a tight share structure and the media attention it has received to date (and will likely continue to receive as it’s such a compelling story) should keep interest in this company very high in our view in the coming weeks and months…we’ll be giving BLO plenty of attention at BMR over the summer as we perceive this company to be a very serious business and market opportunity, and what BLO is working on speaks directly to the concerns of many people in North America who don’t have a cavalier attitude toward the use of marijuana…the reality is, though, that marijuana use and “acceptance” are on the rise in our society, and that’s how BLO could BLO very big…
BLO is a first-mover in developing a roadside handheld breathalyzer to detect THC from an individual’s very recent use of marijuana…it has an exclusive North American license for patent pending marijuana breathalyzer technology, and pioneering world experts on THC breath testing are directly involved with the company…last week, we spoke with CEO Rav Mlait…management is very approachable and we encourage readers to reach out to them as part of their own due diligence…the President of BLO is Kal Mahli, a retired member of the RCMP who clearly understands the need for this type of technology for law enforcement to deal with the growing problem of drug-impaired driving…
Keep in mind, the current alcohol breathalyzer market in North America is worth in excess of $3 billion…the key for any successful business is to identify a niche and fill that need with an exceptional product or service…while of course speculative, West Point has massive upside potential in our view given the quality of its team, the unique product it’s developing for potential future widespread commercial use, the industry it’s in, and its attractive share structure…
BLO is off a penny at 20.5 cents as of 8:15 am Pacific…
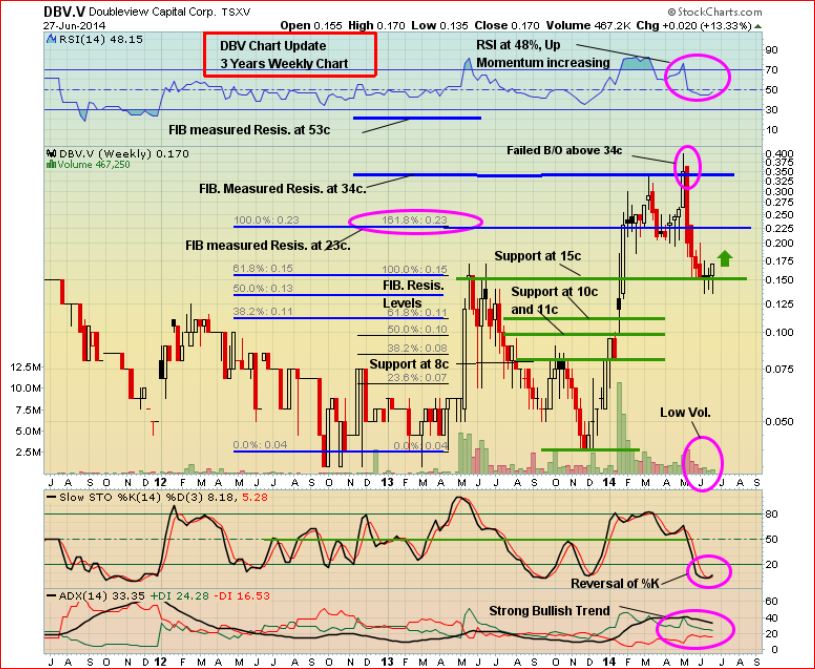
Doubleview Capital Corp. (DBV, TSX-V) Chart Update
The emotions of fear and greed drive markets, as do expectations…all three of those factors have been evident in the trading of Doubleview Capital (DBV, TSX-V) this year…
Expectations have lowered considerably for Doubleview over the last six weeks which in our view increases the potential for an upside surprise – the mirror image of the situation that existed in early May…
Important technical support around 15 cents has held in DBV, and John’s 3-year weekly chart that warned about Fib. resistance in the mid-30’s in early May is now showing evidence of a bottom and a reversal in its early stages…DBV, which commenced a fourth phase of drilling at its Hat Property in early June, closed at 17 cents Friday…
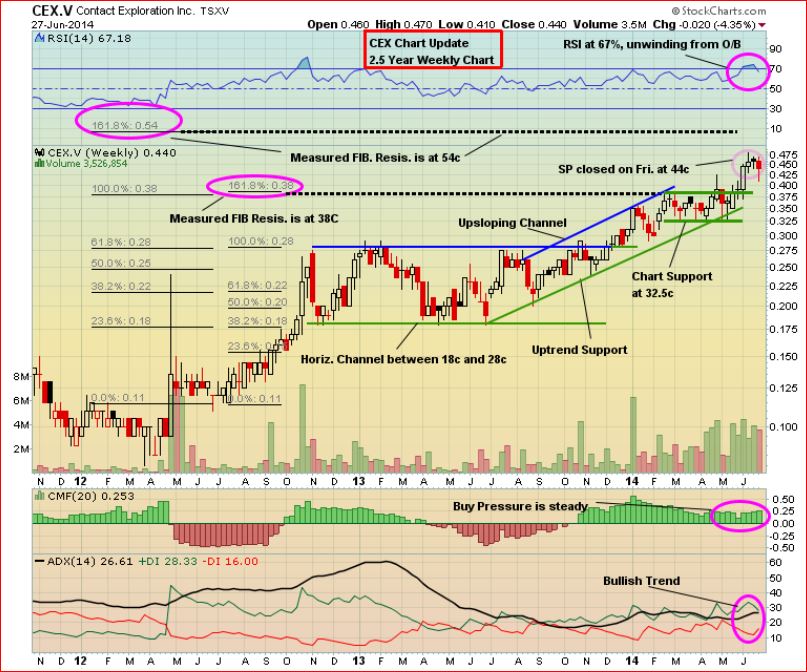
Contact Exploration Inc. (CEX, TSX-V) Updated Chart
Calgary-based Contact Exploration (CEX, TSX-V), one of our favorite energy plays since it was trading in the 20’s last year, staged a confirmed breakout above Fib. resistance at 38 cents during this second quarter, and climbed as high as 48 cents earlier this month…the rising 50-day SMA at 40 cents is solid new support…note also the upsloping channel in place since last year – there’s no reason for CEX to break below that channel, at least not during the upcoming quarter, but watch for an opportunity within the lower half of that channel in the near future on a potential further unwinding of the recently overbought RSI(14) on this 2.5-year weekly chart…the bottom line, though, is that a strong primary uptrend remains in force…
CEX is up half a penny at 44.5 cents as of 8:15 am Pacific…
Blackbird Energy Inc. (BBI, TSX-V) Updated Chart
Blackbird Energy (BBI, TSX-V) has consistently found support at its rising 50-day SMA since first breaking above that level in late February, and after climbing as high as 31 cents in mid-May…
Below is a detailed 6-month daily chart from John…the SMA-20, currently at 25 cents, is now rising again, and RSI(14) has recently bounced off support…BBI looks poised for a strong Q3…as always, perform your own due diligence…

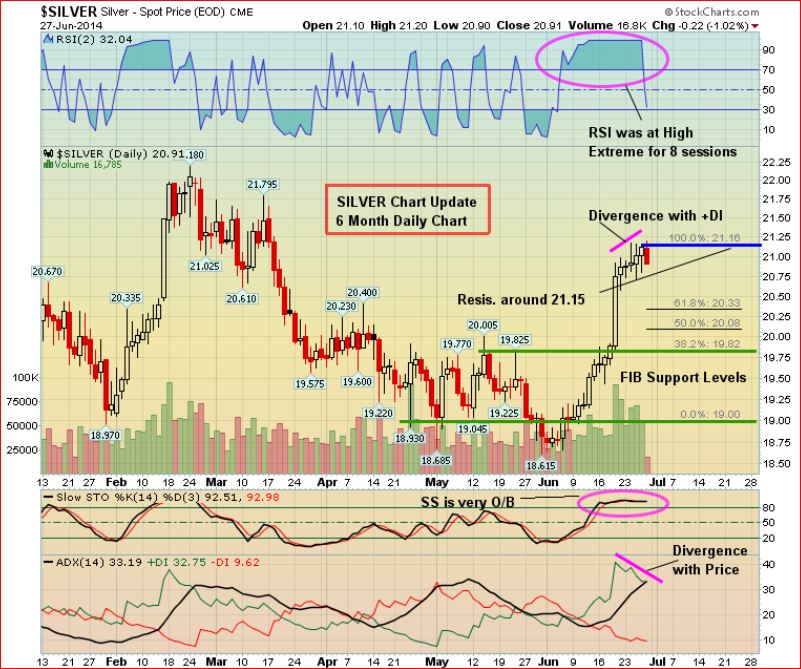
Silver Short-Term Chart
This 6-month daily chart shows recent extreme RSI(2) conditions that are now unwinding, and will likely need to unwind a little more…hence a mild pullback in Silver should be expected before the next push higher…John has outlined three Fib. retracement levels – $20.33, $20.08 and $19.82…
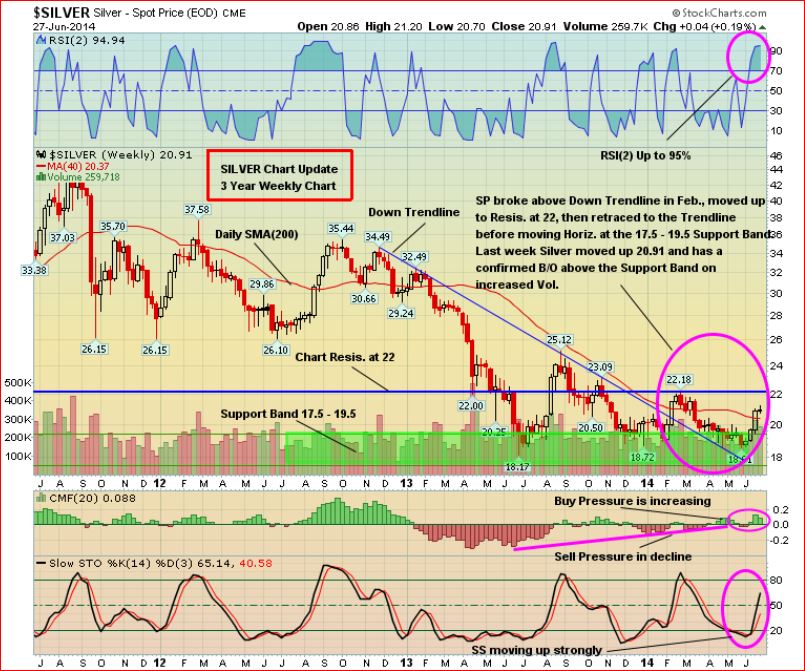
Silver 3-Year Weekly Chart
Silver’s support band between $17.50 and $19.50 is like the 970 support area for the Venture – it will hold, and Silver has now boldly pushed above that support band…the $19.50 area should hold on any near-term pullback…
Early this year, Silver broke above a downtrend line in place since late 2012 on this 3-year weekly chart…similar to the Venture pattern during the fourth quarter of last year, Silver has found support at the top of this downtrend line…overall sell pressure has been in decline since early 2013…slowly but surely, the metal is on its way higher but expect the pattern to be a couple of steps forward, one step back…
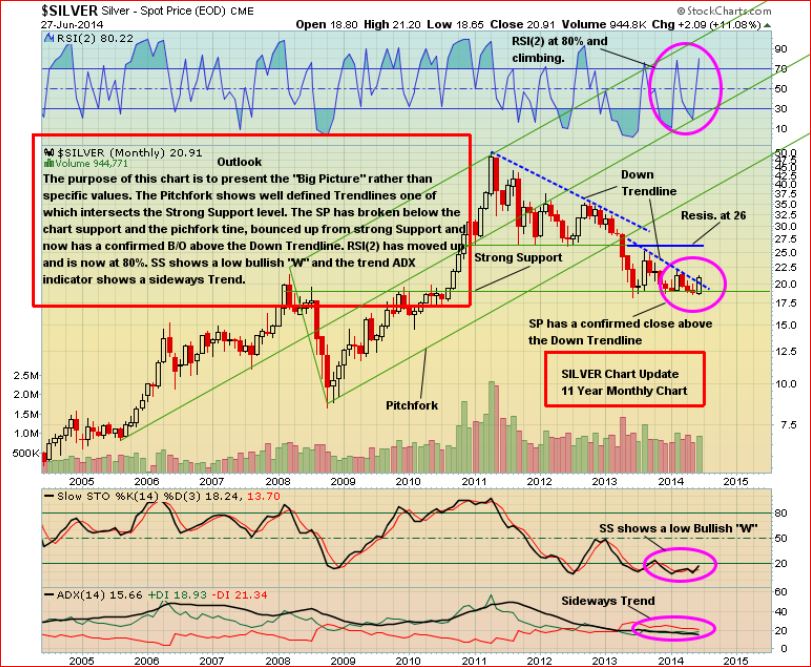
Silver Long-Term Chart
This 11-year monthly chart confirms that the metal has exceptional support in the high teens…note that there are two downtrend lines on this chart – Silver has closed above one of those downtrend lines, but barely…expect more activity in the immediate vicinity of that downtrend line before a decisive move above it at some point during Q3…
If and when Silver clears stiff resistance at $26, watch out – you’ll want to back up the truck and load up…the COT structure, as mentioned last week, has become very favorable, suggesting Silver is gearing up for a strong move over the summer…
Note: John and Jon both hold share positions in DBV. Jon holds a share position in BLO.