
Gold has traded between $1,313 and $1,327 so far today…as of 7:30 am Pacific, bullion is up $3 an ounce at $1,321…Silver has climbed 15 cents to $21.05…Copper is flat at $3.12…Crude Oil is slightly higher at $106.26 while the U.S. Dollar Index has gained nearly one-tenth of a point to 80.36…Zinc prices continue to march higher, hitting their highest levels since early 2013 on worries over diminishing supplies of the metal, which is used primarily to galvanize steel and make rust-resistant products…supplies are dwindling as demand from the construction industry is ramping up globally whiles mines shut down…
 Holdings in global ETPs fell to 1,712.9 tons on June 20, the lowest since October 2009, data compiled by Bloomberg shows…we view this as a bullish sign, not a bearish one…investors have sold 49.9 metric tons from Gold-backed ETPs this year, compared with a record 869.1 tons that wiped more than $73 billion off their value in 2013…the selling compares with average annual purchases of 291 tons over the last nine years…sales of American Eagle Gold coins by the U.S. Mint have totaled 252,500 ounces this year, 60% less than in the first six months of last year and the lowest for the period since 2008, data on its web site show…even better, the median of 15 analyst and trader estimates compiled by Bloomberg by June 18 showed Gold will average $1,240 in the fourth quarter and $1,300 in the first three months of next year…by June 20, they were predicting $1,225 and $1,270 for the periods, not swayed by Janet Yellen’s outlook for low borrowing costs until Christ’s return…
We wouldn’t want to bet against Gold given the way the Venture is behaving and the posture of the 20-year monthly Gold chart that we are sharing with our readers today…
India Monsoon Season Update
About 80% of India has received deficient to scanty rainfall between June 1 and June 23, according to India Meteorology Department data, deepening concerns about the potential impact of a below-normal monsoon…things may not get better in the next few weeks – the extended range forecast from the Indian Institute of Tropical Meteorology says that monsoon activity over the country will be weaker until mid-July…India’s southwest monsoon runs from June to September…the rains have an impact on the Gold price as India’s rural farming areas account for about 60% of the country’s Gold purchases…a bad monsoon which leads to poor crops and rising food costs will hit farmers in their wallets, depriving them of money to buy Gold, as well as possibly forcing them to sell at least some of their existing Gold holdings…
Today’s Equity Markets
Asia
China’s Shanghai Composite gained 10 points overnight to close at 2034 as traders reflected on better-than-expected manufacturing data for June…Japan’s Nikkei eked out modest gains to hit a new five-month closing high for the second straight session…
Europe
European markets are mixed in late trading overseas…Germany’s Ifo business climate data missed forecasts and hit a fresh low for the year…meanwhile, Bank of England governor Mark Carney adopted a dovish tone in front of U.K. lawmakers today…he raised fresh concerns about low wage growth in the U.K. and the impact that this might have on the bank’s plans to raise rates this year…when the bank does raise rates, Carney said, the move would be limited and gradual…translation – another central bank caught between a rock and a hard place…
North America
Better-than-expected economic reports on housing and consumer confidence have been supportive of U.S. markets this morning…the Dow is up 21 points as of 7:30 am Pacific while the S&P 500 has hit another intra-day record high…the Dow has gone 32 months without a 10% decline, the fifth-longest run on record…meanwhile, the S&P 500 hasn’t closed up or down 1% in 46 days, the longest stretch since 1995…
The TSX is up 16 points through the first hour of trading while the Venture is unchanged at 1023…
Real Inflation
Below is an interesting table from David Stockman’s Contra Corner web site (www.DavidStockmansContraCorner.com)…Stockman was President Reagan’s federal budget director until, like most budget directors, he eventually lost his job (apparently he spoke a little too freely with the news media…
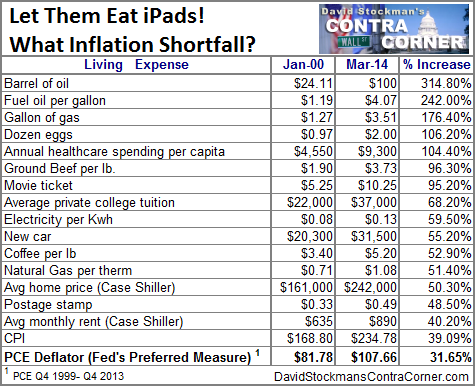
As pointed out at Uncommon Wisdom (www.uncommonwisdomdaily.com), one of our favorite sites, you’ll note that at the very bottom of the list are the two “official” inflation measures…you can see both ran well below the price increases of common consumer goods in the U.S. over the last 14+ years…CPI is nowhere near reality and PCE (Personal Consumption Expenditures, which the Fed uses) is even worse…oddly, the Federal Reserve did use CPI up until the year 2000…then-chairman Alan Greenspan decided PCE would be the benchmark going forward…
Gold 20-Year Monthly Chart
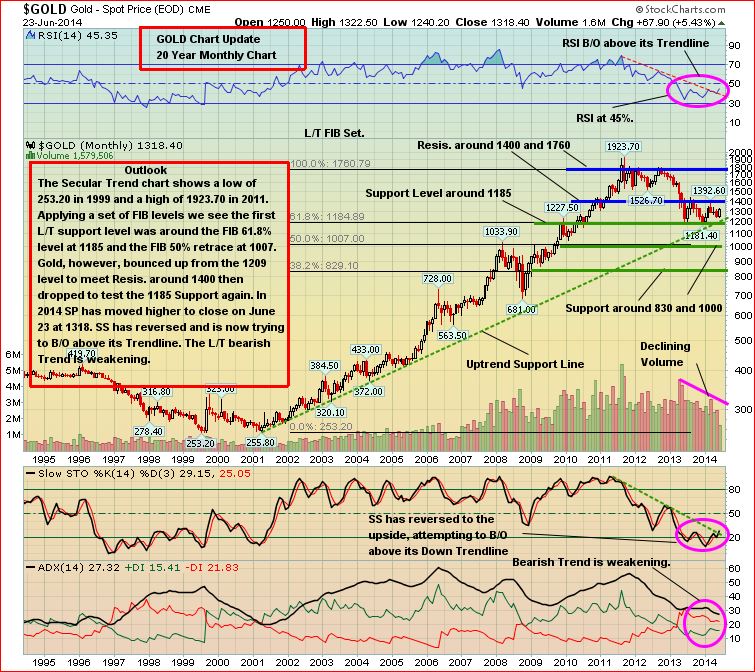
It’s very hard to study this chart and not come to the conclusion that Gold hit bottom last year around $1,180…
This 20-year monthly chart really puts the “Big Picture” in perspective…Gold retreated from an all-time high of just over $1,900 in September 2011 to a long-term support line around $1,200…what’s particularly interesting at the moment is that RSI(14) on this chart has broken above a downtrend line that started in late 2011…in addition, the SS has reversed to the upside after forming an important bottoming pattern and is now attempting to break above its downtrend line…
A key level for Gold to push above during the second half of this year is $1,400…
CRB Index Updated Chart
A 20-year CRB chart shows an important development at the beginning of this year with the Index breaking out above a downtrend line…RSI(14) bottomed at strong support at 40% and has cut through resistance at 50% like a knife through butter…commodities are looking bullish which correlates with what the Venture is telling us with a series of technically bullish indicators…
The 320 area (resistance) on the Reuters/Jeffries CRB Index is important to watch…could react at that level and digest its gains (consolidate) before eventually pushing through…

North American Nickel Inc. (NAN, TSX-V) Update
North American Nickel (NAN, TSX-V), armed with a very healthy treasury, has commenced its 2014 drilling season at its promising 100%-owned Maniitsoq Ni-Cu-PGE Project in southwest Greenland…two diamond drill rigs will be employed with the second one in action by about mid-July…
The first drill is focused on the Imiak Hill Conduit Complex (IHCC) and more specifically on the Imiak Hill zone, where previous drilling intersected 4.3% Ni, 0.62% Cu and 0.14% Co over 18.6 m in hole MQ-13-026 (see NAN Oct. 10, 2013 news release)…the zones at IHCC remain open at depth, and the 2014 drilling will test the down-plunge potential of these Ni-Cu-PGM systems…
The second rig will begin in the Pingo target area located approximately 25 km northwest of the IHCC…
All diamond drill holes will be surveyed using a 3-D (ZXY) borehole pulse electromagnetic system operated by Crone Geophysics and Exploration Ltd., which detects sulphide mineralization up to 100 m away from the hole…this method has been utilized over the last two years of drilling at Maniitsoq and has assisted the geological team in understanding the mineralized systems at IHCC…
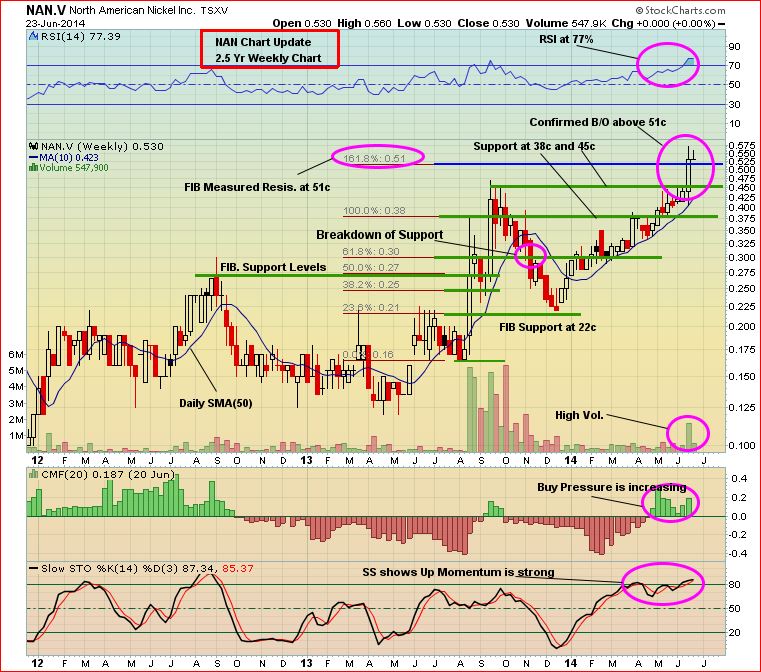
Technically, the NAN chart is interesting in that the stock last Friday broke out above measured Fib. resistance at 51 cents (the next level is 72 cents) and momentum has carried it higher…RSI(14) on this 2.5-year weekly chart through yesterday shows overbought conditions at 77%, so the risk of a minor pullback for “cleansing” purposes clearly exists…
NAN is up 4 cents to 57 cents as of 7:30 am Pacific…
Highbank Resources Ltd. (HBK, TSX-V)
We’ve been closely following developments in Highbank Resources (HBK, TSX-V) the last few months after the company received its Notice of Work (NOW) approval in March from the British Columbia Ministry of Energy and Mines for its Swamp Point North aggregate project on tidewater south of Stewart…the company completed a $2.7 million convertible debenture financing and has been making steady progress toward advancing to production…
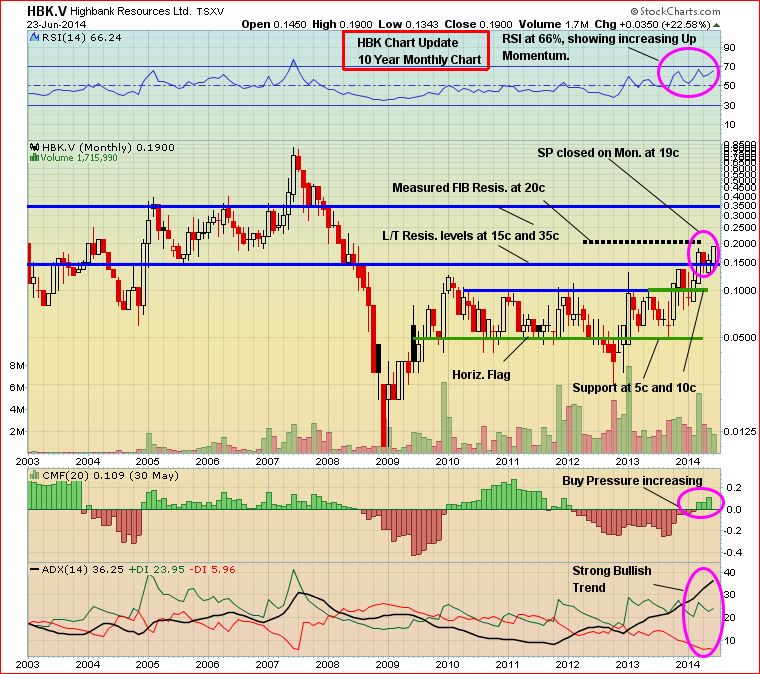
HBK staged an important breakout in mid-March above long-term resistance at 15 cents, and this morning it has touched measured Fib. resistance at 20 cents (keep in mind, Fib. levels are not price targets, just theoretical levels based on Fib. and technical analysis, but Fib. is nonetheless a valuable tool in an investor’s toolkit)…how HBK handles the 20-cent Fib. level over the immediate to near-term will be interesting…
RSI(14) on this long-term chart is showing strong up momentum…as always, perform your own due diligence…
Note: John, Terry and Jon do not hold share positions in NAN or HBK.
3 Comments
That inflation table does not paint a pretty picture. And with the Federal Reserve hell-bent on devaluing the dollar, it will get much worse. The same can be said for Canada. Grocery prices here in Montreal are 11% higher than last year, according to the food I track every single week when I go shopping. Inflation is starting to rear its ugly head, and with the majority of the population just barely hanging on, it will not take much to push them over the edge. 2015 is when the system finally comes tumbling down.
Charts are fine Jon sometimes but fundamentals and a sudden halt on NAN could throw the charts out the window. Remember, NAN is drilling in a known Nickel belt with Nickel Tenor of 6 to 8%. 50% sulfides and you got 3% Nickel. NAN has already hit last year and the odds are extremely high they will hit again.
Don’t disagree with that at all, Dan…..we’ve stated all along that geologically NAN has a major potential winner on its hands, and ultimately that could drive the share price much higher…yesterday’s chart was an update on current/short-term technical conditions…next Fib. level is 72 cents, a possibility of a “minor” pullback for cleansing purposes exists given the current RSI(14) on that 2.5-year weekly chart (and on the 1-year daily for that matter)…but strong support is around 48-50 cents…these guys know what they’re doing both on the ground and in the market, which distinguishes them from most other companies…so this should be an exciting summer for NAN…