
6:30 am Pacific
Gold Bullion came out with news Friday and their booth at the Vancouver Resource Show yesterday was very busy. The Granada Gold Property has delivered consistently solid results throughout the past year and we see no reason why that’s going to change, especially after Friday’s news that mineralization continues to remain open in all directions at Granada and new mineralized structures have been intersected throughout the Preliminary Block Model and the Eastern Extension. New assay results are expected in the “very near future”. Steady and consistent progress – that has been the GBB story for the past year as the company continues making progress toward its goal of outlining a potential multi-million ounce open-pit deposit at Granada. This is very much reflected in GBB’s chart – John updates the bullish Gold Bullion picture below:

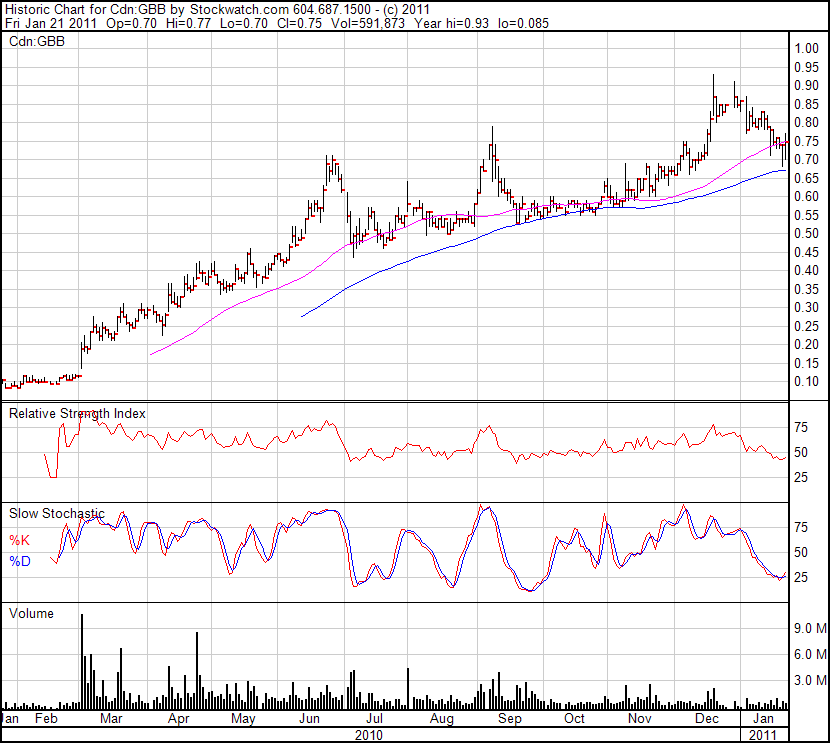
On Friday, Gold Bullion Development opened at 70 cents, its low, then climbed to a high of 77 cents before closing at 75 cents. It gained 1 penny on CDNX volume of 592,000 shares.
Looking at the 6-month daily chart we see solid support (green horizontal line) at 70 cents and two resistance levels at 78 cents and 87 cents. From December 20 to now the trading has formed a downsloping flag (flag boundaries not shown) which has over the last 4 weeks retraced the price from a high of 93 cents to ann intra-day low of 67 cents. Obviously the market was not ready to sustain such a powerful move in late December. The volume is now starting to increase and the white candles in the last 2 days show an awakening of the bulls. This could be the base for the start of another move up. Keep an eye on the price possibly breaking and closing above the close supporting moving average EMA(20) which then could become support.
The Fibonacci set shows the next Fibonacci target is at the $1.08 level (this is not a BMR price target as we don’t give price targets but a theoretical Fibonacci level based on technical analysis).
Looking at the indicators: The RSI is forming a bullish “W” formation at the 46% level. Look for the RSI to break above the 50% level this week.
The Slow Stochastics has the %K (black line) at 29% and above the %D (red line) at 25% after forming a bullish “W” formation.
The Chaikin Money Flow (CMF) shows the buying pressure is increasing, especially during the last 2 trading days. It’s currently at the 0.242 level.
Outlook: The chart pattern and the indicators all point to a strong possibility that GBB has found a bottom at the strong support level of 70 cents. GBB will be interesting to watch in the coming weeks.
Note: Jon holds a position in GBB while John currently does not.
5 Comments
Hello BMR.
Any comments about ABI, anything that could be of interest?
No concerns about Abcourt. Has pulled back slightly but no chart damage. I sleep well at night holding this one given the reserves and resources they have in the ground – the overall market hasn’t quite grasped this story yet. ABI has to do a better job of telling it and we believe they will. Drilling continues at Elder-Tagami and Abcourt-Barvue.
Hi Jon,
It appears CUI is still under quite a bit of selling pressure…this appears to be more than just pumpers and dumpers at this point…not sure if something else is happening…I also heard a rumour that some news may come out this week prior to the Toronto Show…Pls let me know your thoughts? Thanks
Yes, it is still under pressure and that’s really not surprising. From a technical standpoint, it’s in heavily oversold territory and when fear starts to set in – “not sure if something else is happening” – that’s usually when you a see a bottom. CUI is in the process of forming a bottom and I would say it’s either at bottom now or very, very close to it. The amount of volume on CUI the last while clearly shows there are plenty of eager buyers at these levels. The value of CUI’s land package in Tanzania has not changed in the last few weeks – what has happened is that near-term speculators have jumped ship. They will also come back at some point as well, no doubt. The company is in great shape and the project we really believe will be a company builder is Sekenke. January has not been a great month for CUI, for sure. February should be better, however.
Thanks Jon, I agree that their company appears to be solid. I also hope Feb is a better month…