
If you were to ask the typical Canadian on the street if they thought the last year or so has been a good time to buy quality Gold stocks, 9 out of 10 would probably say no, given the drubbing Gold has received in the mainstream media – especially from “talking heads” in the United States who can’t see beyond their own borders and thus look at bullion very differently than the rest of the world.
Since peaking at just over $1,900 an ounce U.S. in late 2011, Gold in U.S. dollar terms has experienced a healthy, normal correction of as much as 44% before the latest recovery. A lot of the selling has been eagerly absorbed by Asian investors who have a natural affinity toward the metal. Over the long-term, Gold has established itself as the Ultimate Currency and that trend will probably only intensify in the years ahead. The “talking heads” in the U.S. will eventually understand that reality.
Gold in U.S. dollars has held up impressively over the last year, especially considering the record advance in the greenback. In other currencies, the metal is flat-out, big-time bullish.
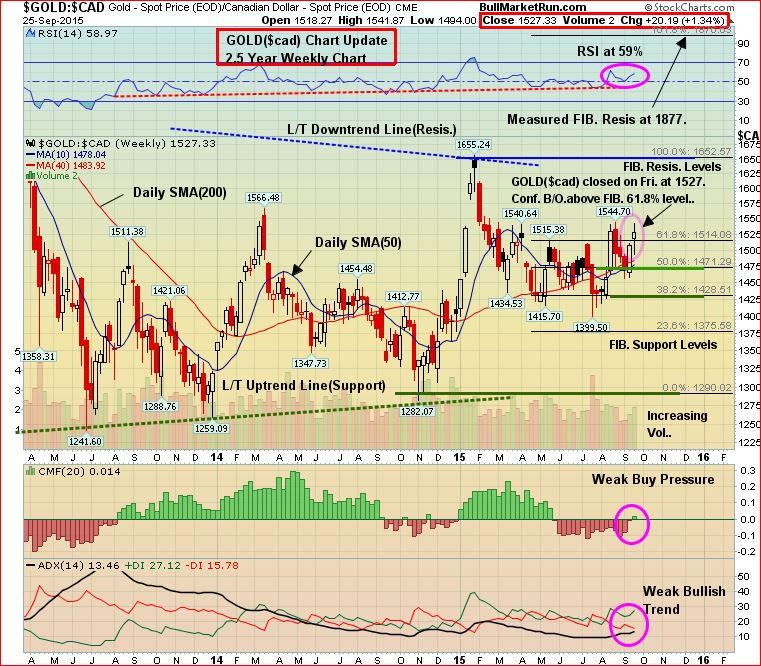
Below is a Gold 2.5-year weekly chart in Canadian dollars. This helps explain why certain smaller Canadian-only producers, such as Richmont Mines (RIC, TSX), Kirkland Lake Gold (KGI, TSX), Claude Resources (CRJ, TSX) and others have performed so remarkably well since mid-2014. We’ve consistently been emphasizing these opportunities to our readers. Feasibility studies and PEA’s for companies like Pretium Resources (PVG, TSX) and Kaminak Gold (KAM, TSX-V) have assumed a much higher Canadian dollar, so project costs for some companies building mines in Canada could be lower than anticipated.
Gold has been in an uptrend in Canadian dollar terms since the 2nd quarter of 2013, climbing 23% during that period based on Friday’s close of $1,527 CDN. Gold surged to $1,655 CDN near the end of January, retraced to Fib. support at $1,400 by July, and has since pushed through 3 levels of Fib. resistance while the 200-day moving average (SMA), currently $1,484 on this weekly chart, continues to rise.
What appears increasingly likely during the upcoming quarter is a re-test of the downtrend line from the 2011 high, which was about $1,900 CDN, and that downtrend line currently intersects around $1,630 (this would equate to more than $1,200 U.S.). Every indicator on this chart is positive. Note how RSI(14) has been following an uptrend line since 2013 and is now showing increasing momentum.
If and when Gold breaks through $1,650 CDN, watch out – it could spike significantly higher very quickly from there.
In loonie terms, quite simply, Gold is a bull gaining speed.
Gold In Euros
Gold is looking great in euros as well. It bottomed in late 2013 and has been in an uptrend ever since, recently bouncing off the uptrend support line. Significantly, RSI(14) has broken out above its downtrend line that formed after the early 2015 high of 1165 euros. The 200-day SMA has been climbing from the summer of last year. A bullish +DI cross appears to be forming, and SS is at a bullish position as well.

1 Comment
jon, when you get a minute,(ha ha) could you give a look at NMI.v Newmarket gold, it looks very good. Thank you Richard l