
TSX Venture Exchange and Gold
The CDNX snapped a 4-session losing skid with a 10-point gain Friday to trim its weekly loss to just 3 points. With only one trading day left in June, the Index at 1023 is up 39 points or 2% for a month which historically is the weakest of the year for the Venture. This bodes very well for the upcoming third quarter with the near certainty of a powerful breakout above the mid-March high of 1050, carrying the Index into a significantly higher trading range as one can see in John’s 5-year weekly chart.
Technically, the Venture has never been better positioned for a sustained advance in several years. This is easier to see on the 5-year weekly chart with multiple indicators. What’s particularly intriguing at the moment is the “squeeze” between the now-rising 300-day moving average (SMA) around 970 (an incredible support area) and the 500-day SMA which has now flattened out just slightly above 1050. The Index will take the path of least resistance which in our view means a critical breakout is looming above the 500-day. The last time the Index pushed through this SMA was at the beginning of 2010.
The current technical posture of the Venture is signalling that important fundamental events – new discoveries, takeovers, an unexpected rise in Gold, etc. – are on the horizon, triggers that will catch many investors by surprise and provide the necessary fuel for this market to commence an accelerated advance. This is the mirror image of early 2011 when the Venture’s technical health sharply deteriorated and warning signs were flashing like a red light.
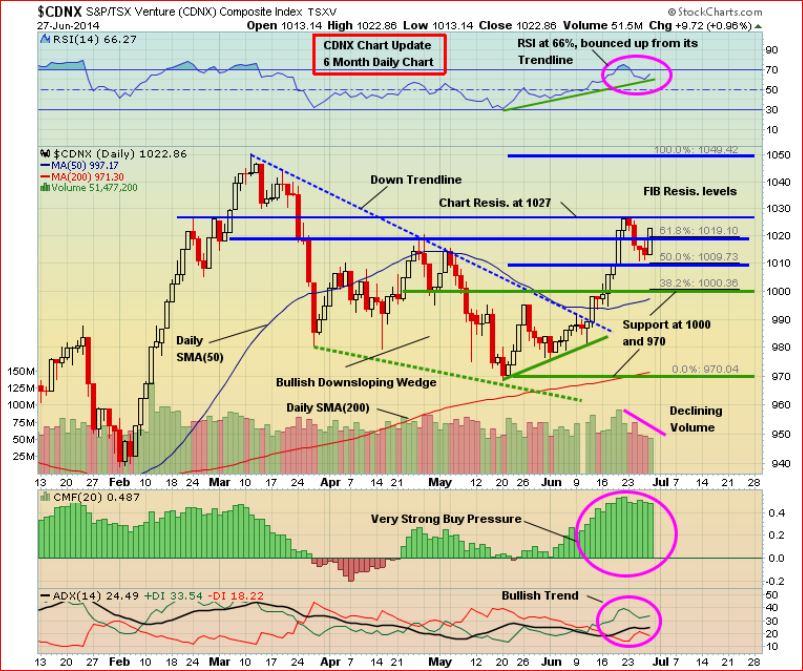
Venture 6-Month Daily Chart Update
The breakout above the short-term downtrend line in mid-June proved to be significant, as we pointed out at the time. How soon the Index will surge past 1050 is impossible to predict – there will be some resistance along the way, and this effort may take more than one try. But the bottom line is that this will occur, and the 1000 level (as opposed to 970) is now the new major support.
RSI(14) on this 6-month daily chart is looking very strong – climbing an uptrend line – with room to move higher at 66%. Note the rapid acceleration in buy pressure this month as shown by the CMF. The ADX trend indicator is further evidence that the bulls are in firm control of this market.
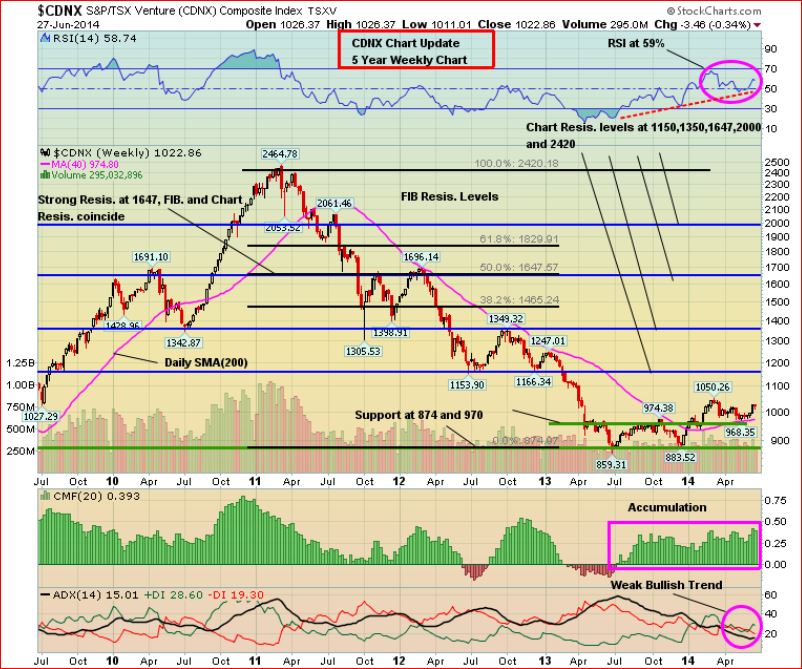
Venture 5-Year Weekly Chart
John’s long-term weekly chart shows 1150 – 1350 as a reasonable target range for the CDNX over the next 6-9 months, with a major acceleration in the bullish 2014 pattern to occur during Q3.
It’s important to point out that RSI(14) on this 5-year weekly chart found a “comfort zone” in the immediate vicinity of the 50% level, as expected. A modestly overbought condition in the RSI(14) that emerged in March when the Index hit 1050 gradually unwound, with RSI(14) now on the upswing again at 59% (plenty of room to move higher). The recent decline that took the Venture to important support at 968 May 20 came on light volume, and accumulation (CMF indicator) remains steady and strong – the most extended period of healthy accumulation we’ve seen, actually, in a few years. This is a very bullish scenario, and includes a recent +DI/-DI crossover. Those who have given up on this market recently have made a profound miscalculation. Astute investors could cash in big on this market during the third quarter in particular.
The Seeds Have Been Planted (And Continue To Be Planted) For The Next Big Run In Gold Stocks
There’s no better cure for low prices than low prices. The great benefit of the collapse in Gold prices in 2013 is that it forced producers (at least most of them) to start to become much more lean in terms of their cost structures. Producers, big and small, have started to make hard decisions in terms of costs, projects, and rationalizing their their overall operations. Exploration budgets among both producers and juniors have also been cut sharply. In addition, government policies across much of the globe are making it more difficult (sometimes impossible) for mining companies to carry out exploration or put Gold (or other) deposits into production, thanks to the ignorance of many politicians and the impact of radical and vocal environmentalists (technology has made it easier for groups opposing mining projects to organize and disseminate information, even in remote areas around the globe). Ultimately, all of these factors are going to create a supply problem – think about it, where are the next major Gold deposits going to come from? On top of that, grades have fallen significantly just over the past decade.
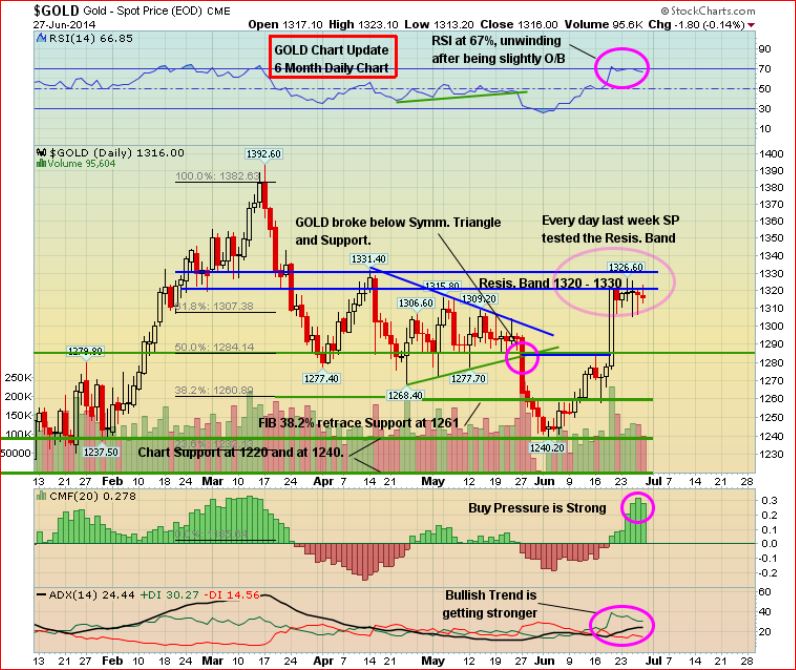
Gold
Gold finished unchanged last week at $1,315 after previous weekly advances of $39 and $24, respectively. The first important area of technical support is $1,294 – $1,310, while a strong resistance band exists between $1,320 and $1,330 as shown in John’s 6-month daily chart.
RSI(14) at 67% is unwinding after becoming slightly overbought (it will likely need to unwind a little more). The set-up for the third quarter looks very bullish, but Gold likely has to test new support levels first before powering higher as Q3 progresses.
Silver finished essentially unchanged last week, falling a penny to close at $20.87. John will have updated Silver charts tomorrow morning – a short-term overbought situation has emerged in the metal, so the likelihood of a pullback in the next week or two has increased significantly. Copper gained 6 pennies to $3.16. Crude Oil fell by just over $1 a barrel to $105.74 while the U.S. Dollar Index tumbled by one-third of a point to 80.02.
The “Big Picture” View Of Gold
As Frank Holmes so effectively illustrates at www.usfunds.com, the long-term bull market in Gold has been driven by both the Fear Trade and the Love Trade. The transfer of wealth from west to east, and the accumulation of wealth particularly in China and India, has had a huge impact on bullion. Despite Gold’s largest annual drop in three decades in 2013, the fundamental long-term case for the metal remains solidly intact – currency instability and an overall lack of confidence in fiat currencies, governments and world leaders in general, an environment of historically low interest rates, a Fed balance sheet now at $4 trillion and still expanding, money supply growth around the globe, massive government debt from the United States to Europe, central bank buying, flat mine supply, physical demand (especially from China), emerging market growth, geopolitical unrest and conflicts…the list goes on. However, deflationary concerns around the globe and the prospect of Fed tapering had a lot to do with Gold’s plunge during the spring of 2013 below the technically and psychologically important $1,500 level, along with the strong performance of equities which drew “momentum traders” away from bullion. The June 2013 low of $1,179 was likely the bottom for Gold. Extreme levels of bearishness emerged in the metal last year. With the long-term bull market remaining intact, we expect new all-time highs in Gold as the decade progresses. Inflationary pressures should eventually kick in around the globe after years of ultra-loose monetary policy.