
TSX Venture Exchange and Gold
This is a very important week for the Venture as the month of February draws to a close. Despite a 4th straight weekly decline in Gold, which is desperately trying to hold important support around $1,200, and softness in Crude, the Venture gave up just 2 points last week to finish at 695.
What’s interesting at the moment is that the Venture’s 50-day moving average (SMA) is now reversing to the upside. Reversals in this SMA are typically meaningful, as was the last one in September. Investors who exited the market when the 50-day started moving south in early September were spared a huge drop in the Index. This is an indicator that cannot be ignored; however it must be viewed in a broader context of where the Index is at overall technically and fundamentally.
The Key Levels To Watch
The Venture this month has traded in a tight range between 678 and 700, last week’s intra-day high. We know that key resistance (chart and Fib.) is 707 and that the Index has not been able to close above 700 this year with the exception of January 2 when it finished at the 707 resistance and then declined to strong support around 660. There is also solid support (Fib. and the 50-day SMA) around 680.
It’s critical for investors to stay focused on the above numbers and let the Index reveal where it wants to go. A confirmed breakout above 707 would clearly imply increased bullishness and an immediate run higher to test the next important resistance around 750. A break below 680 would be bearish. Those are the simple facts.
Watching Oil and Gold
Keep in mind, the Venture has a very high correlation with Oil at the moment. Another immediate spike down in Crude Oil, which can’t be ruled out in these volatile commodity markets, would complicate matters for the Index. Likewise, a significant move in Gold, up or down, would also impact the Venture even though its correlation isn’t as high with bullion right now as it is with Oil.
We Need A Discovery, Some Excitement
If there was ever a time the Venture could use a major new discovery, it’s now. But that’s made more difficult by the fact that there has been a continuing reduction in the number of companies actually drilling and carrying out significant exploration. Some possibilities do exist, however, in various jurisdictions.
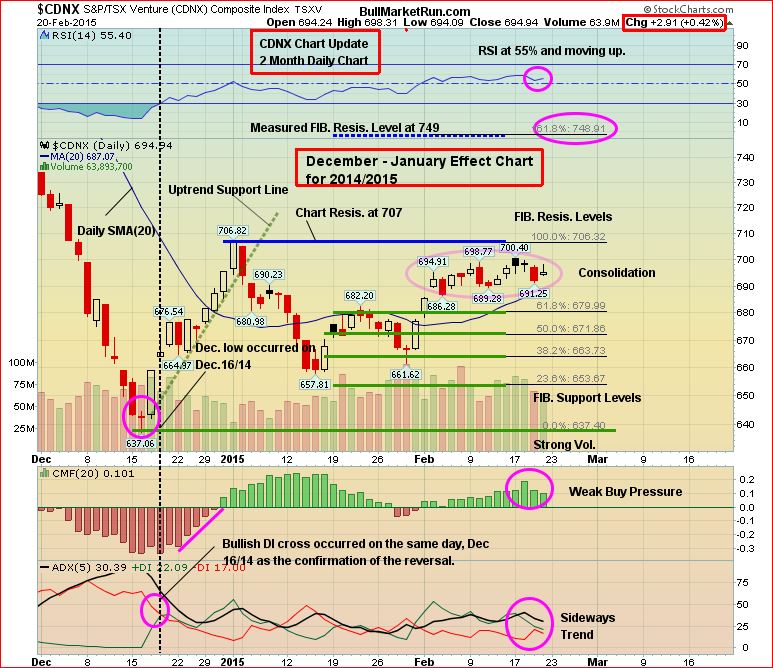
Venture 2-Month Daily Chart
This very short-term chart (2 months) shows a cluster of Fib. support between 654 and 680, with 680 really being the key in our view. The 20-day SMA, currently 687, continues to rise which of course is positive. RSI(14) has managed to hold above 50% the entire month and is starting to trend higher again at 55%. Buy pressure (CMF) has picked up since the start of February and remains steady, albeit not robust. The ADX indicator shows a sideways trend but +DI is still above -DI.
The Venture’s current state offers some encouragement but if this Index were a doctor’s patient, the doctor would feel more comfortable if this patient were able to take his overall health further away from the danger zone to a new level – the fitness reading that needs to be surpassed is 707.
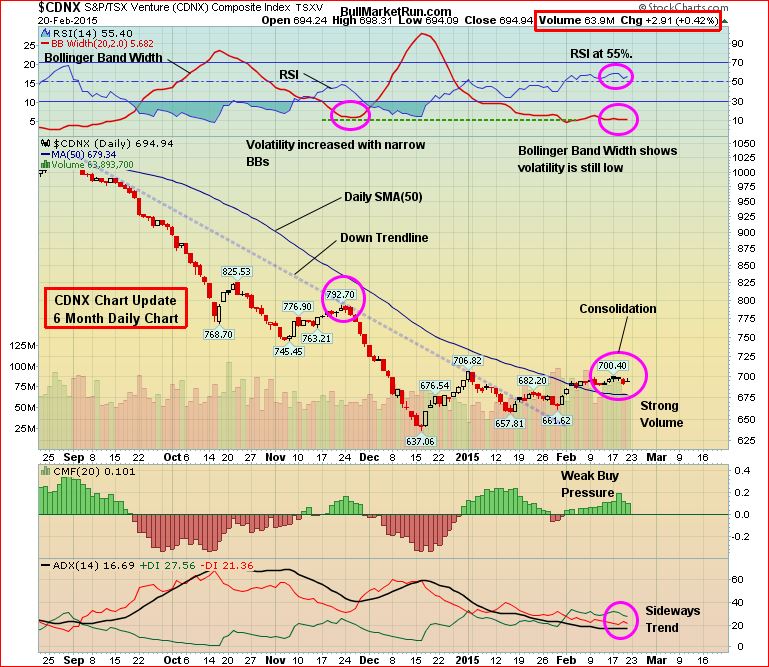
Venture 6-Month Daily Chart
The Venture’s 6-month chart shows 2 important developments:
1. A confirmed breakout above the 50-day SMA (this moving average is currently at 679 – Venture support) which is now beginning to reverse higher – more traction is needed in that regard in the coming week;
2. A confirmed breakout (during the second half of January) above the downtrend line in place since September.
Bollinger Band Width remains low, which reflects minimal volatility and how the Venture is proceeding at the speed of a very slow moving train.
The Seeds Have Been Planted (And Continue To Be Planted) For The Next Big Run In Gold Stocks
There’s no better cure for low prices than low prices. The great benefit of the collapse in Gold prices in 2013 is that it forced producers (at least most of them) to start to become much more lean in terms of their cost structures. Producers, big and small, have started to make hard decisions in terms of costs, projects, and rationalizing their their overall operations. Exploration budgets among both producers and juniors have also been cut sharply. In addition, government policies across much of the globe are making it more difficult (sometimes impossible) for mining companies to carry out exploration or put Gold (or other) deposits into production, thanks to the ignorance of many politicians and the impact of radical and vocal environmentalists (technology has made it easier for groups opposing mining projects to organize and disseminate information, even in remote areas around the globe). Ultimately, all of these factors are going to eventually create a supply problem and therefore great opportunities in Gold and quality Gold stocks. Think about it, where are the next major Gold deposits going to come from? On top of that, grades have fallen significantly just over the past decade.
Gold
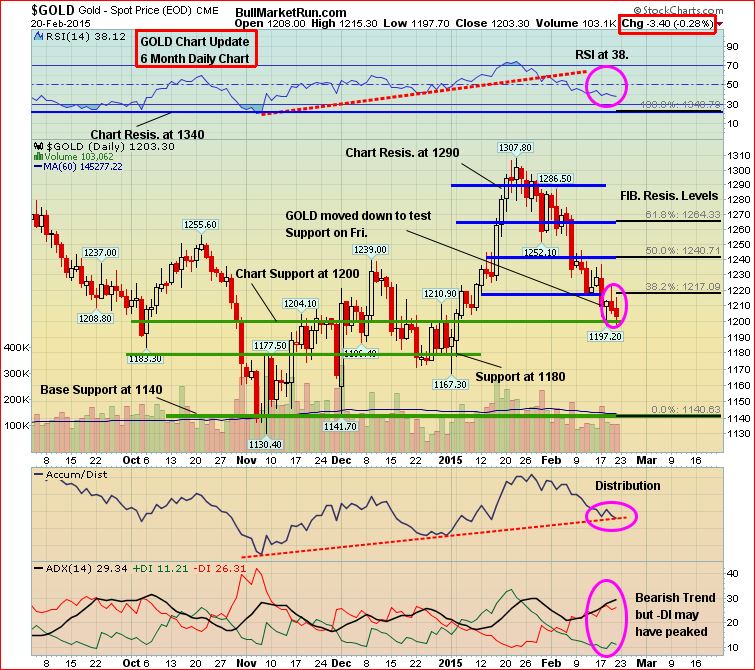
Gold has declined for 3 straight weeks and is now trying to remain above important support around $1,200. This week could be pivotal for the yellow metal, and we’ll show why in charts tomorrow.
Gold jumped $100 an ounce in January thanks in part to weakness in U.S. equity markets. However, upside momentum has returned to U.S. stocks and that raises questions about what investors will be “chasing” in March. The Dow posted its first record close of the year on Friday, while the S&P 500 ended the week at its third record close for the year. The Nasdaq, meanwhile, is rapidly nearing its all-time high set 15 years ago. Will March be a big month for stocks at the expense of Gold?
What’s disturbing about the 6-month daily Gold chart below is how RSI(14) at the beginning of February fell beneath an uptrend line in place since the early November “bottom”. In addition, 3 Fib. support levels have been breached with relative ease this month. This leaves the $1,180 to $1,200 support band as vital. The long-term monthly chart that we’ll be posting tomorrow can be viewed with encouragement, so it would be premature at this point to suggest bullion is about to fall out of bed again even though downside risks have increased. The coming week and the monthly close will be critical in terms of setting the tone for March.
Silver tumbled by nearly $1 an ounce last week to close at $16.27 (updated Silver charts tomorrow morning). Copper fell 3 cents to close at $2.58. Crude Oil slowed down after 3 strong weeks and finished at $50.81, a loss of nearly $2 a barrel. The Dollar Index closed relatively unchanged at 94.31.
Interestingly, the U.S. Dollar Index is also in a consolidation pattern at the moment. Both Gold and the greenback have been moving in tandem the last few months which goes against the historical norm. The next sharp jump in the Dollar Index (it’s in a powerful primary bull market) could also be accompanied by another move higher in bullion. Gold and the greenback are the 2 strongest currencies in the world.
The “Big Picture” View Of Gold
As Frank Holmes so effectively illustrates at www.usfunds.com, the long-term bull market in Gold has been driven by both the Fear Trade and the Love Trade. The transfer of wealth from west to east, and the accumulation of wealth particularly in China and India, has had a huge impact on bullion and will continue to support prices. Despite Gold’s largest annual drop in three decades in 2013, the fundamental long-term case for the metal remains solidly intact based on the following factors:
- Growing geopolitical tensions, fueled in part by the ISIS and al Qaeda, and a highly dangerous and expansionist Russia under Vladimir Putin, have put world security in the most precarious state since World War II;
- Weak leadership in the United States and Europe is emboldening enemies of the West;
- Currency instability and an overall lack of confidence in fiat currencies;
- Historically low interest rates;
- Continued strong accumulation of Gold by China which intends to back up its currency with bullion;
- Massive government debt from the United States to Europe – a “day of reckoning” will come;
- Continued net buying of Gold by central banks around the world;
- Mine closings, a sharp reduction in exploration and a lack of major new discoveries – this these factors should contribute to a noticeable tightening of supply over the next couple of years.