
TSX Venture Exchange and Gold
The Venture rose for the second straight week on a modest increase in volume, closing Friday at 703 – just 4 points below critical resistance. Significantly, short-term moving averages (10 and 20-day SMA’s) have reversed to the upside. Sell pressure (CMF) on our regular 5-month daily chart has decreased rapidly over the last week, a pattern similar to mid-March when the Index started a 7.6% advance over 21 trading sessions. The coming week is the Venture’s best chance in the last 4 months to stage a technical breakout and challenge the next major resistance around 750.
The Venture has shown exceptional support since December, and has managed to stay at or above its gently rising 100-day SMA since early April. A key market to watch, of course, is the U.S. Dollar Index which rallied last week – not an unexpected event after it sold down to temporary support. On any rally it faces considerable resistance in the upper 90’s given the double top pattern that formed in March and April, in addition to some other bearish indicators.
Further gains in the CRB Index are also likely between now and the end of the summer, as John has shown in recent charts, and Copper (a reliable leading indicator) is looking very interesting as well from a broad perspective, despite last week’s pullback. Crude Oil likely found its bottom in the low $40’s while strength in Gold producers suggests a 3-year correction in the yellow metal may indeed have ended last November. So the Venture’s upside potential as this quarter progresses exceeds its downside risk, a very different scenario than the one that existed last September when the Index simply fell apart technically, driven largely by the collapse in Crude prices. Yes, the resistance just above 700 is frustrating but the Venture has also been building a strong base over the last 5 months.
5-Month Daily Venture Chart
Last weekend, we stated we were watching closely for the imminent potential of a sharp decrease in sell pressure on this 5-month daily chart. That’s exactly what occurred over the shortened 4-day trading week. Every indicator on this chart now points to a much greater chance than mid-April for a near-term breakout above 707.

The Seeds Have Been Planted (And Continue To Be Planted) For The Next Big Run In Gold Stocks
There’s no better cure for low prices than low prices. The great benefit of the collapse in Gold prices in 2013 is that it forced producers (at least most of them) to start to become much more lean in terms of their cost structures. Producers, big and small, have started to make hard decisions in terms of costs, projects, and rationalizing their overall operations. Exploration budgets among both producers and juniors have also been cut sharply. In addition, government policies across much of the globe are making it more difficult (sometimes impossible) for mining companies to carry out exploration or put Gold (or other) deposits into production, thanks to the ignorance of many politicians and the impact of radical and vocal environmentalists (technology has made it easier for groups opposing mining projects to organize and disseminate information, even in remote areas around the globe). Ultimately, all of these factors are going to eventually create a supply problem and therefore great opportunities in Gold and quality Gold stocks. Think about it, where are the next major Gold deposits going to come from? On top of that, grades have fallen significantly just over the past decade.
Gold
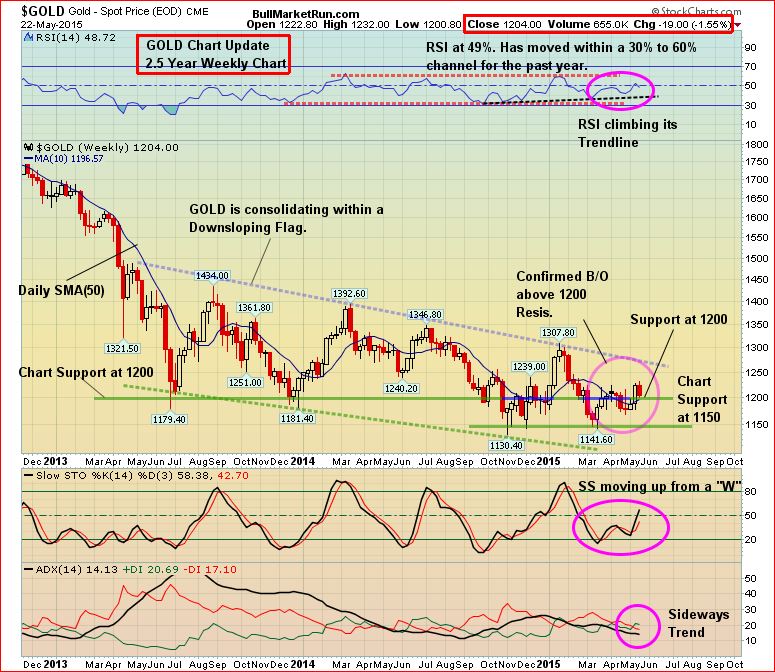
Not surprisingly, Gold met resistance in the $1,220’s last week but also held support at $1,200. For the week it was off $17 as it closed at $1,206, a 1.3% drop, despite a 3.2% gain in the U.S. Dollar Index. Support at $1,200 is also now bolstered by a rising 50-day SMA, currently sitting at $1,197.
Below is one of the most reliable charts we’ve produced for Gold – the 2.5-year weekly. The current bullish pattern in the SS shows that bullion once again could be gearing up for a test of the top of the downsloping flag which currently cuts through the $1,270’s (immediate resistance in the $1,220’s and then $1,240).
Silver eased off 42 cents last week to $17.07 (updated Silver charts Monday morning). Copper retreated 11 cents to $2.79 but still looks healthy. Crude Oil found resistance again in the low $60’s and finished flat for the week at $59.99. The U.S. Dollar Index, meanwhile, surged 3 points to 96.14 but that rally doesn’t concern us any more than the one in April when the Index bounced back to its March high to form a double top.
The “Big Picture” View Of Gold
As Frank Holmes so effectively illustrates at www.usfunds.com, the long-term bull market in Gold has been driven by both the Fear Trade and the Love Trade. The transfer of wealth from west to east, and the accumulation of wealth particularly in China and India, has had a huge impact on bullion and will continue to support prices. Despite Gold’s largest annual drop in 3 decades in 2013, the fundamental long-term case for the metal remains solidly intact based on the following factors:
- Growing geopolitical tensions, fueled in part by the ISIS and al Qaeda, and a highly dangerous and expansionist Russia under Vladimir Putin, have put world security in the most precarious state since World War II;
- Weak leadership in the United States and Europe is emboldening enemies of the West;
- Currency instability and an overall lack of confidence in fiat currencies;
- Historically low interest rates/highly accommodating central banks around the world;
- Continued strong accumulation of Gold by China which intends to back up its currency with bullion;
- Massive government debt from the United States to Europe – a “day of reckoning” will come;
- Continued net buying of Gold by central banks around the world;
- Mine closings, a sharp reduction in exploration and a lack of major new discoveries – these factors should contribute to a noticeable tightening of supply over the next couple of years.