
TSX Venture Exchange and Gold
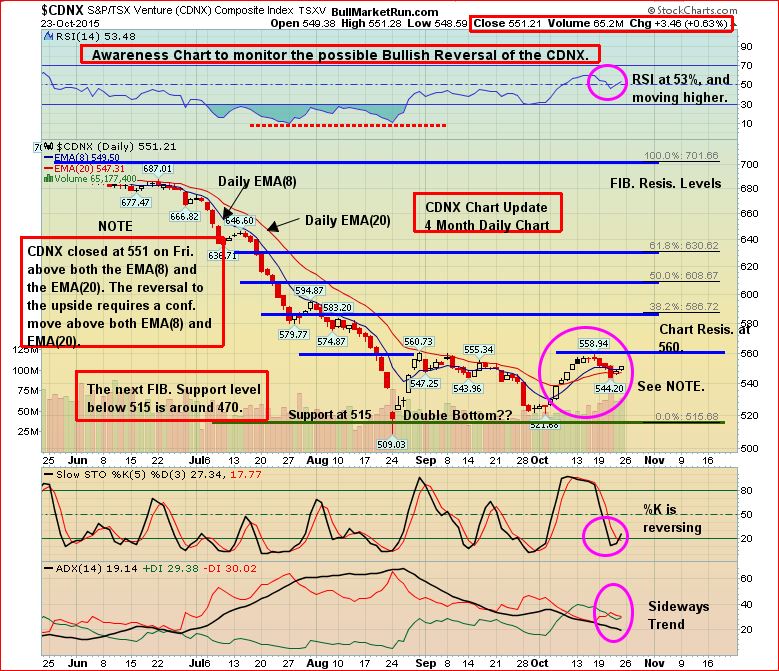
On a pick-up in volume, the Venture tested strong support in the low-to-mid 540‘s as expected, and recovered at the end of the week to reclaim the area above its EMA(8) and EMA(20) moving averages. Key resistance of course is 560. We have a situation, therefore, where the Index is trading within a tight range as it searches for a reason (some sort of “catalyst”) to either bust out to the upside or retreat south. Encouragingly, RSI(14) has indeed turned higher after weakening to the 50% level, while the SS indicator is positioned as it was just prior to rallies near the end of August and at the end of September .
For most of October, the Venture has traded above its 50-day SMA (currently 546) for the first time since May. What will be critical is for this SMA to reverse to the upside. This has a good chance of occurring during the first week of November. Such an event would give the Index the technical momentum it needs to overcome 560 and move toward the next Fib. resistance just below 590. Fundamentally, either a discovery somewhere, strength in certain commodities, or an across-the-board surge in equities would act as an important trigger to lift the Venture.
If you’re not yet a BMR subscriber, be sure to sign up TODAY because we have at least two more “immediate actionable trades” as part of tomorrow’s Sunday Sizzler, in addition to other exclusive subscriber-only research material we’ll be sharing imminently that we’re certain you won’t want to miss.
To date, in recent weeks, our 4 “immediate actionable trades” are all up in value and have gained an average of 23% (37%, 44%, 10.5% and 1%, respectively). That would more than pay for the modest price of a 6-month subscription which is risk-free as it comes with a 100% money-back satisfaction guarantee. Other situations we’ve highlighted in our Sunday Sizzler Report have also performed extremely well, and tomorrow we’ll be updating a 2-cent opportunity that has tremendous short-term and longer-term possibilities as B.C.’s best-kept secret.
To learn more and to sign up, click here.
Venture 4-Month Daily “Awareness” Chart
The August 24 intra-day low of 509, and the immediate reversal, is looking more significant than ever.
The Seeds Have Been Planted (And Continue To Be Planted) For The Next Big Run In Gold Stocks
There’s no better cure for low prices than low prices. The great benefit of the collapse in Gold prices in 2013, and this summer’s weakness with the drop below $1,100, is that it has forced producers to become much more lean in terms of their cost structures. Producers, big and small, continue to make hard decisions in terms of costs, projects, and rationalizing their overall operations. Exploration budgets among both producers and juniors have also been cut sharply. In addition, government policies across much of the globe are making it more difficult (sometimes impossible) for mining companies to carry out exploration or put Gold (or other) deposits into production, thanks to the ignorance of many politicians and the impact of radical and vocal environmentalists (technology has made it easier for groups opposing mining projects to organize and disseminate information, even in remote areas around the globe). Ultimately, all of these factors are going to eventually create a supply problem and therefore historic opportunities in Gold and quality Gold stocks. Think about it, where are the next major Gold deposits going to come from? On top of that, grades have fallen significantly just over the past decade.
Keep in mind, as well, that in currencies other than the U.S. dollar, Gold has been performing exceedingly well. So don’t get fooled by the widespread negativity in the American media toward Gold at the moment. Bullion in Canadian dollars, for example, is in a major bull phase (above $1,500 CDN), and certain high-quality Canadian Gold producers have given investors tremendous returns over the past year or two – and still represent great value.
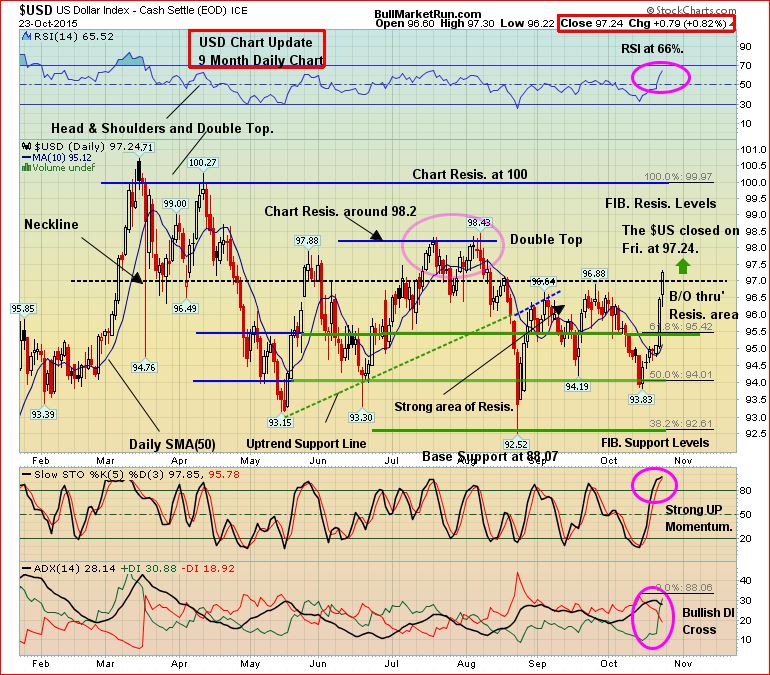
U.S. Dollar Index 9-Month Daily Chart
The Dollar Index staged a sudden reversal Thursday when the euro took a beating following comments by ECB President Mario Draghi that strongly suggested the central bank would expand or extend its QE program by December. While a weak currency helps the euro zone, a strong greenback is a problem for both the U.S. economy and the Fed. Ironically, the higher the dollar goes on euro weakness or speculation of possible Fed tightening, the less the chance becomes of a near-term rate U.S. rate hike as the high value of the dollar is hurting corporate earnings and adding to deflationary pressures throughout the American economy.
An important part of the Fed’s mandate is to get inflation back to a 2% target level, and the surge in the greenback since the summer of last year has greatly complicated that task for the Fed. In addition, according to the Fed’s own research, the greatest impact of the higher greenback has yet to be felt (the “lag” effect). We doubt the Fed has the courage to hike rates until at least well into next year – perhaps even not until after the November 2016 elections.
Technically, despite a powerful week, we still see problems ahead for the dollar as we’ve been stating for several months since the March high of 100.71 and the spring double top. Two uptrend support lines were broken, and resistance at 98 has been relentless since late May.
The Dollar bulls have been stampeding on a false promise by the Fed to hike rates. To add insult the injury, the U.S. is losing prestige on the international stage. We still hold the view that the greenback will be pressured in the coming months, and that would certainly be supportive for Gold, Crude Oil, and the Venture.
Gold 6-Month Daily Chart
We were correct in our prediction last weekend that Gold would likely ease off to support around $1,160 after enjoying a powerful 2-week run that took it to the beginning of a resistance band at $1,190. The yellow metal lost $14 an ounce to close Friday at $1,164.
According to respected analyst Adrian Day of Adrian Day Asset Management, the “tide has turned” in favor of Gold. “Investors are no longer concerned about whether the Fed will raise rates any particular time; that particular boy has cried wolf far too often,” he said. “Investors generally are underweight Gold; we feel there will be meaningful short-covering and, soon, a scramble to buy from investors who have been waiting on the sidelines.”
On John’s 6-month daily chart, you’ll note that RSI(14) hit resistance recently at 70%, which is why we expected a modest pullback this past week. Buy pressure has also been on the decline. Overall, however, the trend is bullish with a strong support band between $1,130 and $1,160 (previous Fib. resistance). Within this band is the rising 50-day SMA, currently $1,138.
Preferably, Gold will be able to maintain the $1,160 support. If not, there’s little reason to be concerned unless bullion were to dive below both the 50-day SMA and Fib. support at $1,130, with RSI(14) also breaking a general uptrend.

Silver lost 22 cents last week to finish at $15.81, just slightly above a Fib. support level. Copper declined a nickel to $2.35. Crude Oil tumbled more than $2 a barrel to $44.73 while the U.S. Dollar Index surged more than 2 points to close just above 97.
The “Big Picture” View Of Gold
As Frank Holmes so effectively illustrates at www.usfunds.com, the long-term bull market in Gold has been driven by both the Fear Trade and the Love Trade. The transfer of wealth from west to east, and the accumulation of wealth particularly in China and India, has had a huge impact on bullion and will continue to support prices. Despite Gold’s largest annual drop in 3 decades in 2013, and weakness this past summer, the fundamental long-term case for the metal remains solidly intact based on the following factors (not necessarily in order of importance):
- Growing geopolitical tensions, fueled in part by the ISIS and al Qaeda, and a highly dangerous and expansionist Russia under Vladimir Putin, have put world security in the most precarious state since World War II;
- Weak leadership in the United States and Europe is emboldening enemies of the West;
- Currency instability and an overall lack of confidence in fiat currencies;
- Historically low interest rates/highly accommodating central banks around the world;
- Continued solid accumulation of Gold by China which intends to back up its currency with bullion;
- Massive government debt from the United States to Europe – a “day of reckoning” will come;
- Continued net buying of Gold by central banks around the world;
- Mine closings, a sharp reduction in exploration and a lack of major new discoveries – these factors should contribute to a noticeable tightening of supply over the next couple of years.
12 Comments
What about Tax loss season again in Nov/Dec? So, how can we move up in November? Thanks.
Steven, there have been years in which the Venture has performed well in November. I would expect some tax-loss selling to kick in during late November/first half of December. So a move higher first, a pullback, and then a very strong finish to December and a great start to the New Year is a scenario that could certainly unfold. Keep in mind that the intense selling over the summer should mitigate some of the normal tax-loss pressure that occurs from late November through the first 2 or 3 weeks of December.
Jon you know if Chad Day made an opposition at the injunction , I know that Wednesday he had not opposed but there were still 24 hours?
Guy, I’m not sure. The injunction date is Friday, Oct. 30. We’ll obviously get some answers this coming week.
Jon, I’m hoping that a NR will come out following the photos that were posted on GGI’s website after the market closed on Friday. This must have a positive effect on the SP, have you any thoughts as to what might happen tomorrow when trading is underway. I understand that we will need assay results for a definitive answer but everything seems to be pointing that they have hit something good with their first hole.
Tom, I expect GGI will have something to say in the next couple of days. Very likely a good start to the trading week tomorrow. The chart looks exceptional, and most importantly all the indications are that they are into a system at Grizzly Central which is supported by all the evidence to date. Still early in the game, but looking very promising so far. Kaketsa could really be driving this particular area which is fault-bounded, providing the pathways for hydrothermal fluids to carry mineralization through the intrusives and dykes.
Big week for all Sheslay !
Yes, Guy, we’ll have to pay close attention to developments with DBV (re: the injunction) and of course what’s happening on the ground at Grizzly Central. Very important week for the entire district.
Hope everyone looked at LTE.c last week. What a great week!
CRS.v kaboom as well..
SLC.v A bottom play that looking better
Thanks, BigRig. Just looked at a chart from John on CRS. Potential certainly for a breakout above .22. That’s a key level. It’s looking strong for sure.
While you are awaiting drill results from V.EQT, Wolfden Resources (V.WLF) just came out with the drill results (7 of 11 holes reported) which Include 1.50% Ni & 0.57% Cu across 36.2m and 3.97% Ni & 0.95% Cu across 4.6m.
Read on Newswire website “Wolfden Drilling confirms high-grade nickel & copper at Rice Island”… Oct.26, 2015
GGI surface outcrop pics