
TSX Venture Exchange and Gold
The Venture responded pretty much on cue last week, likely landing at its December low on Tuesday at 494 – a day ahead of last year’s bottom. On Wednesday, of course, the Federal Reserve hiked its Fed-funds rate for the first time in nearly a decade. This removes a major “overhang” from commodities as speculation regarding the start of Fed tightening put added pressure on this battered sector over the last year-and-a-half, with the U.S. Dollar simultaneously enjoying a powerful advance. What remains to be seen is whether the Fed becomes the first central bank since the 2008 financial crisis to be able to maintain higher interest rates – no less than 7 other central banks have had to backpedal on monetary policy due to economic weakness. Meanwhile, the Fed has consistently misjudged the inflation picture as well as the extent and seriousness of the Oil price decline. So we’re in for a fascinating 2016, a year in which Gold could easily surprise to the upside even if that means testing $1,000 support first.
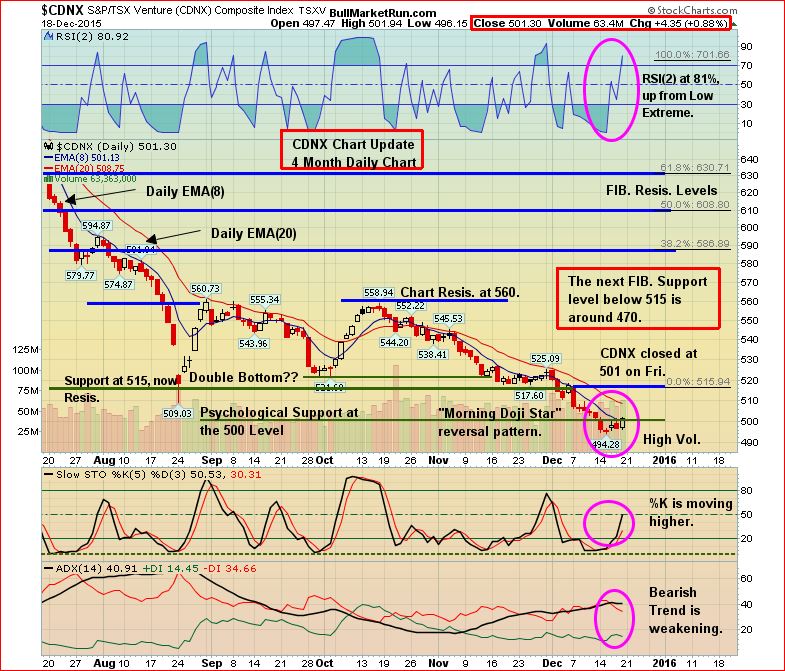
Venture 4-Month Daily Chart
The Venture finished the week above the psychologically important 500 level with a “Morning Doji Star” reversal pattern, so there’s little doubt in our view that the Index is in the early stages of a rally – timing of which is consistent with 14 years of trading history that shows average gains in December, January and February of 4.5%, 4.3% and 4.4%, respectively. We’re now into traditionally what has been the best 3-month period on the calendar. Sector leaders during this time will likely include Gold and Lithium plays (Crude Oil remains under pressure, and the non-resource companies who have done well in recent months should continue to outperform). Selectivity as usual will be key – we’re not anticipating a broad-based surge. The “heavy lifting” will be carried out by the top 10%, the 200 or so companies who are well-positioned at the moment to “make things happen”.
For the week, the Venture lost 1 point to close at 501. It held up well at the end of the week despite a 3.5% drop in the Dow Thursday-Friday and Gold’s biggest single-day decline in 5 months on Thursday. What has been very different about this quarter for the Venture, compared to Q4 last year, is how the Index has retreated so little (4.6%) vs. commodities in general, suggesting U.S. dollar strength may have peaked for the time being.
Technically, the Venture’s immediate challenge is to get back above resistance at its EMA(8) and EMA(20) – currently 501 and 509, respectively – and remain above those moving averages long enough in order to allow them to reverse to the upside (this is what started the October rally which, notably, collapsed October 29 when the Fed signaled the likelihood of a rate hike at its next meeting).
Previous support at 515 is now resistance, so that’s certainly a level the Venture must climb above by month-end in order to build momentum and take a run toward 560.
The Venture “December-January” Effect
80% of the time over the last 15 years, the Venture’s December low has occurred by the 18th of the month. And in every case, this was followed by a significant reversal to the upside. The Venture would be aided significantly by a strong Gold performance in January and if commodities in general can stabilize after a difficult couple of months and a challenging 2015 overall.
Gold & Stocks During Rate Hike Cycles
Historically, it’s a myth that Gold performs poorly during Fed rate hike cycles, if indeed that’s what we’re in (barring a sudden Fed retreat in 2016). During the last Fed rate hike cycle, for example, between June 2004 and June 2006, the Fed-funds rate more than quintupled to 5.25% through 17 consecutive hikes totaling 425 basis points. Gold powered 49.6% higher over that exact span. There are numerous other example of Gold moving higher concurrently with interest rates, though it seems the ill-informed mainstream media, particularly in the U.S., have convinced much of the general public that Gold is simply a bad investment in an environment of rising interest rates.
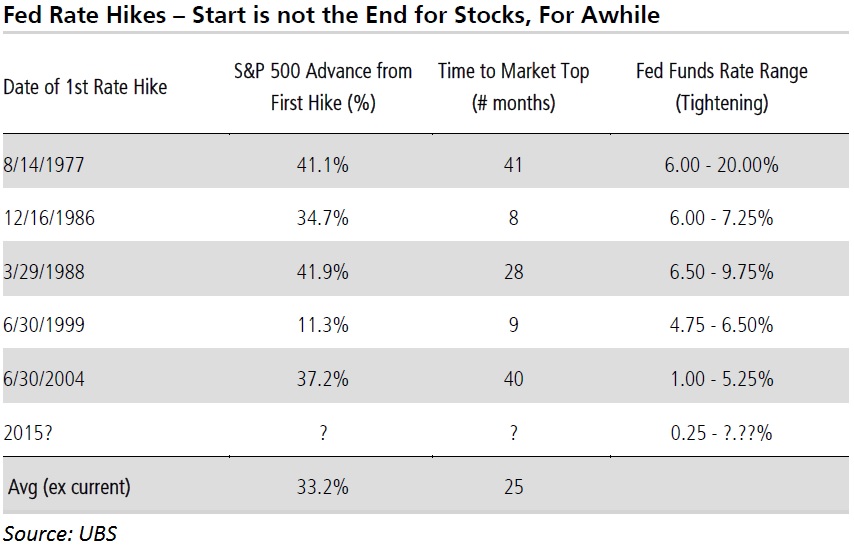
As far as the broader equity markets are concerned, stocks have performed very well in the first 2 years following the start of rate hikes as you can see in this chart below:
U.S. Dollar Index Updated Chart
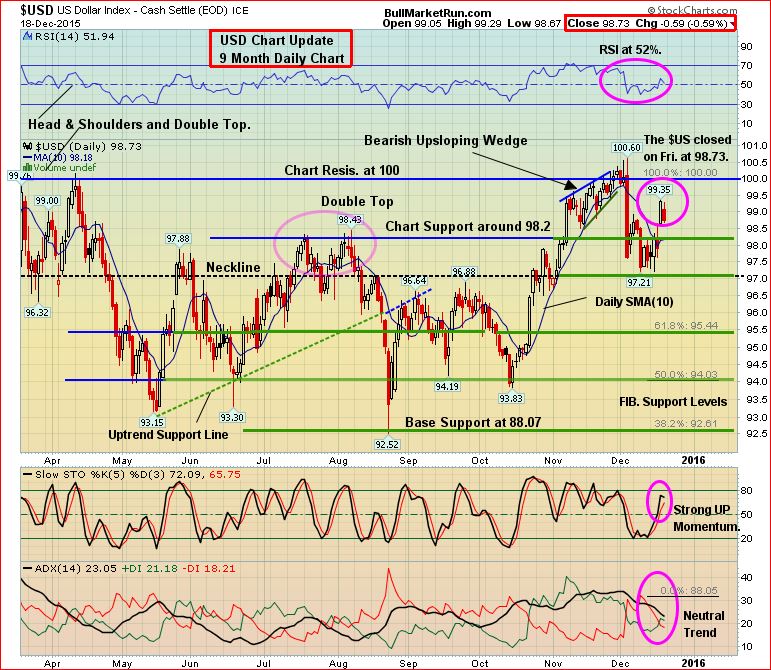
It may take another failed breakout attempt above 100 to take the wind out of the sails of the U.S. Dollar Index which showed signs of weakness prior to the Fed meeting but pushed higher to close the week at 98.72. Speculation has helped keep the greenback buoyant over the last year-and-a-half. But with an interest rate hike now out of the way, the Dollar Index is susceptible to a strong correction if some weaker-than-expected economic data start rolling in. A breakdown below 97 or a breakout above the March high of 100.71 are two possibilities to watch for. It’s hard to imagine how the U.S. economy would benefit from the latter scenario – resistance will be powerful between 100 and 101.
Gold
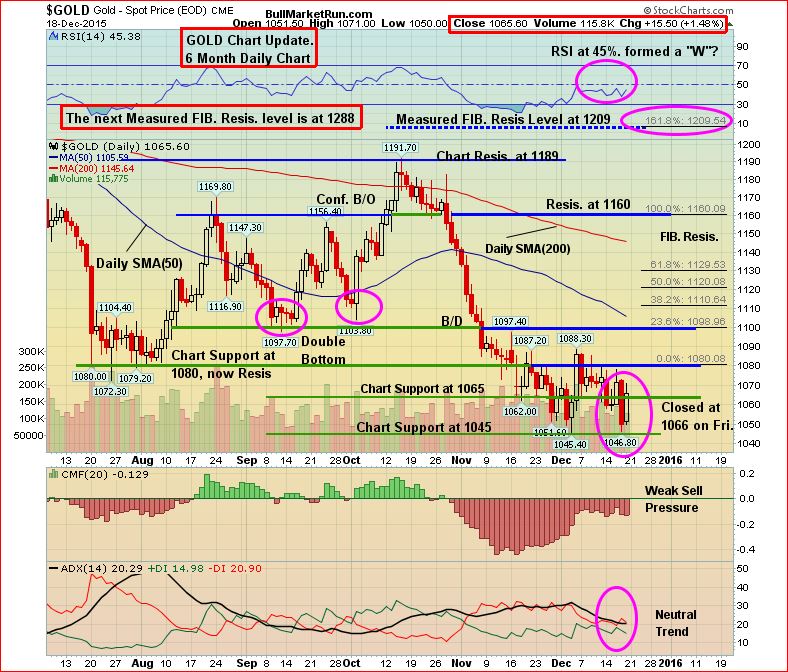
Gold bounced around like a ship in wild seas last week, retesting its December 3 low before finishing strong on Friday to close at $1,066. This 6-month chart shows a favorable RSI(14) pattern since last month (it’s possible that a bullish “W” is forming) while sell pressure has declined sharply since mid-November. For now, bullion is in a range between $1,045 and $1,080. It will take the path of least resistance which, we believe, will be to the upside based on a host of factors including a bullish COT structure (the smart-money commercial traders are signaling that a rally is in the works).
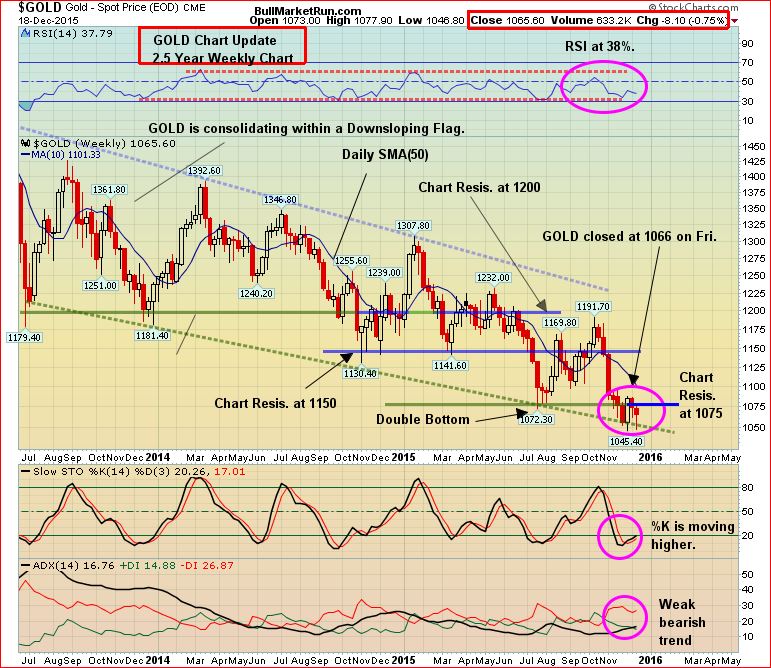
Gold 2.5-Year Weekly Chart
All signs (technical, sentiment, short positions, etc.) have been pointing toward a turnaround in Gold and Gold stocks, which is why we encouraged subscribers last month to go long on the double-leveraged HGU around the $3 level ($15 post-consolidation).
The most reliable Gold chart over the last couple of years has been the 2.5-year weekly. Facts are facts, and each time Gold has hit the bottom of its downsloping channel since late 2013, a major rally has taken the metal back up to (or near) the top of the channel within about 3 months. Those moves have averaged about 15%.
We believe two short-term scenarios are possible – Gold challenges chart resistance at $1,150, but the rally stops there. Or, bullion surges to the top of the flag (just above $1,200). It will then either break out massively from that point, for some reason unknown at this time (a “Black Sawn” event), or it will tumble like it has before after hitting the top of the channel.
Silver gained 19 cents last week to close at $14.08. Copper fell a penny to $2.12. Crude Oil, after plunging nearly $5 a barrel the week before, lost another $1 a barrel as WTI finished at $34.55, while the U.S. Dollar Index gained just over a full point to 98.62.
The “Big Picture” View Of Gold
As Frank Holmes so effectively illustrates at www.usfunds.com, the long-term bull market in Gold has been driven by both the Fear Trade and the Love Trade. The transfer of wealth from west to east, and the accumulation of wealth particularly in China and India, has had a huge impact on bullion and will continue to support prices. Despite Gold’s largest annual drop in 3 decades in 2013, and current weakness, the fundamental long-term case for the metal remains solidly intact based on the following factors (not necessarily in order of importance):
- Growing geopolitical tensions, fueled in part by the ISIS and al Qaeda, and a highly dangerous and expansionist Russia under Vladimir Putin, have put world security in the most precarious state since World War II;
- Weak leadership in the United States and Europe is emboldening enemies of the West;
- Currency instability and an overall lack of confidence in fiat currencies;
- Historically low interest rates/highly accommodating central banks around the world;
- Continued solid accumulation of Gold by China which is “backing up” its currency with bullion;
- Massive government debt from the United States to Europe – a “day of reckoning” will come;
- Continued net buying of Gold by central banks around the world;
- Mine closings, a sharp reduction in exploration and a lack of major new discoveries – these factors should contribute to a noticeable tightening of supply over the next couple of years.
26 Comments
pretty similar thoughts here at TDG: http://thedailygold.com/gold-stocks-remain-in-position-to-rebound/
Jon, what are your friends geologists says about drill hole 4 at 292?
Jon is correct, rush samples do hold the risk of things getting overlooked and missed. It has happened on many occassions. This is one reason why many companies dont do it anymore. Rush samples are rare in today’s scheme of things. Everyone on this board is entitled to their opinion. Jon and I combined proabaly have some 60 years experience in this business. It does not mean we know everything and don’t pretend too. But when we voice things that we personaly know to be correct and then read somewhat negative comment on it, that can be frustrating sometimes. GGI did the right thing by not rushing assays at this time and in this market. Trust me, You may not realize this but YOU want assays right after the 1st. I will leave it to the impatient ones to figure out why. EQT released their assays prior to xmas for a very good reason, again leave it to all of you to think about it. Yes, EQT has to release results within so many days, but they could have called the lab and told them to hold them till after new years allowing them to not have to report the results. EQT and GGI have very good CEO’s who know what they are doing, and there are very good reasons for both. Have a good Sunday.
excuse my typpo’s, doing this on a cell phone as i await my laptop to get settled and normal again
If GGI has the goods they can release them at any time and the market will reevaluate the value of the company accordingly. They don’t have to wait till the 1st..like Jon said if regocci has them next week he would be happy to release them the day before Christmas. The only time you have to be careful when you release assays…is when your assays aren’t that great. Do you think when Aurelian hit it would have mattered which day of the week they released or if they released before Christmas….Nope…when you have good assays…you can’t stop the market from noticing them. Anyways…enough said…have a good night all
Dave, I think you said you were not always happy about holding stock when assays were due. Given the core photos and Regoci’s comments, are you holding any GGI at the moment?
For me, rush assay does not change the analysis method all that changes is to ask the laboratory to be analyzed as they arrive at the laboratory. The method of analysis made by the technician is standard and all results from computer!
Martin, are you sure the core pic 292.7 meters is from hole 4? I thought it might be from hole 5 given when they posted it along with the last 4 pics posted.
Sorry Hole 5,
TomUk- no, not holding any GGI, but money is ready if assays make the stock run and I truly hope they do.
What would really get the market’s attention is if GGI release stellar assays from the Grizzly and then post more shiny drill core from Rodadero. Thinking they have at least one hole drilled at Rodadero by now and knowing their hit ratio wouldn’t surprise me if they have another glory hole in Mexico.
Dave, I think there are many people in your position. Will you be able to buy many at current prices if the results are good? Sellers will soon dry up IMO if the news is very good.
The IR people told me that many samples had been sent to the lab. The NR tells us that several different fire assays are being done on each sample. Drills have been laying quiet for 2 – 3 years so labs have cut back on staff. Add it all up and you have an explanation as to why the assays are not back yet.
Oban have had 3 drills turning at the Eagle Hill project since October and they definitely are only looking at gold, no results have yet come back for them.
Any chance GGI releases holes 1 to 5 assays in a batch?
Here is an assay company that has it right – 10 day turn around….much easier to plan an ongoing drill program when your not waiting for assays
Eastern Analytical
We have had many of the same clients since opening our doors over 25 years ago. This is attributed to our dedication to customer service which includes a 10 day turn around because all work is done onsite by trained local employees. Our commitment to combine fast and accurate results has helped discover many of the mines currently in operation in our province.
Dan, they have been sitting on results from La Patilla for 10 weeks, so there is definitely plenty of news that could flow throw in the near future. They might wait until new year before releasing anything.
Again, similar thoughts to the guys here: pinnacledigest.com/blog/aaron-hoddinott/tsx-venture-traders-secret
TomUK- yes I can buy many if assays are good. The problem with todays market vs. 2006/07, is results that made stocks move back then are not perceived the same way in todays market and cause a sell on the news. GGI chart is about the same formation that eqt was back when it hit .22. It topped out, did the little loop over and started coming down. Look at each high since ggi hit .17, a similar pattern is developing. Now, I hope I’m wrong, but the chart has that 30 degree slant angle to it. It will take very good assays to change this and get it going north short term. Take all stockcharts and throw them out the window, chart shows weakness right now
GGI, Dave – if charting and technical analysis was perfect or worked all the time everyone would learn it well and be rich. The fact that it not perfect and is a lagging indicator. That being said I’m holding GGI and hope for great assays as there doesn’t seem to be any positive speculation priced into the price.
Dave IMO the reason EQT dived from .22 on high volume is due to the leakage of abhorrent results. With that in mind, is it fair to compare the EQT and GGI charts? jmo
Apples and oranges, CC. EQT simply got ahead of itself with a $17 million market cap, and 100% above its 200-day SMA, for a property in a grassroots district with just 1 drill hole over 250+ sq. km, a major “swing for the fences”. Garland could still prove to be a winner, but EQT would do itself an immediate favor with a second project. GGI currently has a modest $9 million market cap, is trading just 27% above its 200-day SMA, and has shown strong evidence of a new discovery in a proven district – plus, of course, they have a high-grade discovery at Rodadero where the rig has been mobilized for follow-up, in addition to several other significant projects. As far as charts go, again, no comparison – CMF indicator (buy pressure) is strengthening significantly for GGI right now, whereas it peaked for EQT in August – 2 months ahead of the share price high.
George – TA and charts are a lagging indicator. That was a good one, please clarify
As people above have said, I think that EQT spiked up on hype and false expectations. GGI’s move up from 5c to 14c is due to the fact that it has rebounded from all the Sprott selling. I know that positive statement have been made by Regoci and some might say that this is hype, but the SP has not moved. I also think that when the results arrive, Regoci will be proved correct. This is very different to the news flow and results that EQT provided.
FCU halted.
Dave – If it was a good one, I dont need to clarify. Self explanatory.
YFI – nice bounce off the 200 MA and support. Keep and eye on it as it could move back up to retest it’s .365 high from the last move up…..it’s been trending up nicely and looks like it could be continuing it’s path.