
TSX Venture Exchange and Gold
A wild January of trading has come to an end with the Venture sliding 26 points or 5% for the month amid high volatility in the broader equity markets. This was brought on by a wide range of concerns from China to signs of slowing economic growth in the U.S. at a time when the Federal Reserve is trying to gradually increase interest rates. In Japan, the central bank actually introduced negative interest rates Friday in an unprecedented move that global equity markets cheered. What it actually showed is how central banks are becoming increasingly desperate in a world in which many governments are simply not pulling the right fiscal policy levers, and that’s nothing to cheer about.
The TSX Composite lost as much as 11.4% through the first 14 trading sessions of the month but bounced back to post a loss of just 1.4%. This compared to a 5.5% decline in the Dow and a 7.8% pullback in the NASDAQ.
Not surprisingly, Gold was the biggest winner of the month as bullion added $57 an ounce or 5.4%. The TSX Gold Index climbed 8.6%, while some individual producers performed even better – Claude Resources (CRJ, TSX) jumped 26%, Detour Gold (DGC, TSX) climbed 18%, Agnico Eagle (AEM, TSX) advanced 14%, Richmont Mines (RIC, TSX) gained 13.5%, and Lake Shore Gold (LSG, TSX) added 13.4%. Operationally, those companies are among the best performers in the industry and they will continue to garner favor from investors, especially if Gold prices continue to track higher.
Venture Updated Chart
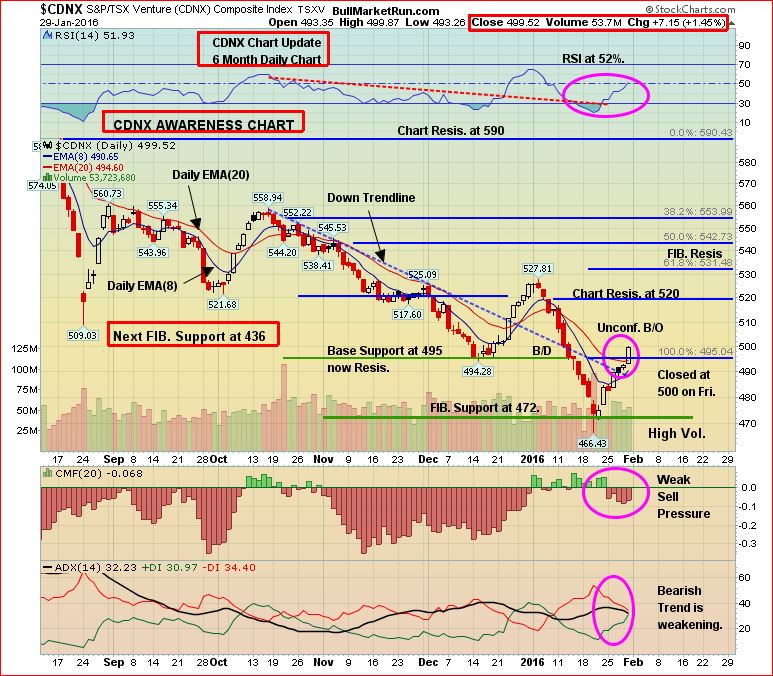
As expected, the Venture has worked its way back to previous resistance at and near 500. It’s inconclusive what the next move will be, but whatever direction the Venture decides to take will be important. Will the Index be able to gain traction again above 500, or will it slip back?
Last week’s gain of 16 points would have been more encouraging had it occurred on significantly higher volume and increased buy pressure which wasn’t the case. In fact, weak buy pressure (CMF) that emerged at the end of December has been replaced by weak sell pressure.
We can’t tell the market what to do – we need to let it tell us what it wants to do, and this coming week should provide some answers.
The Seeds Have Been Planted (And Continue To Be Planted) For The Next Big Run In Gold Stocks
There’s no better cure for low prices than low prices. The great benefit of the collapse in Gold prices in 2013, and last summer’s fresh weakness with the drop below $1,100, is that it has forced producers to become much more lean in terms of their cost structures. Producers, big and small, continue to make hard decisions in terms of costs, projects, and rationalizing their overall operations. Exploration budgets among both producers and juniors have also been cut sharply. In addition, government policies across much of the globe are making it more difficult (sometimes impossible) for mining companies to carry out exploration or put Gold (or other) deposits into production, thanks to the ignorance of many politicians and the impact of radical and vocal environmentalists (technology has made it easier for groups opposing mining projects to organize and disseminate information, even in remote areas around the globe). Ultimately, all of these factors are going to eventually create a supply problem and therefore historic opportunities in Gold and quality Gold stocks. Think about it, where are the next major Gold deposits going to come from? On top of that, grades have fallen significantly just over the past decade.
Keep in mind, as well, that in currencies other than the U.S. dollar, Gold has been performing exceedingly well over the past couple of years. So don’t get fooled by the widespread negativity in the American media toward Gold. Bullion in Canadian dollars, for example, is in a major bull phase and certain high-quality Canadian Gold producers have given investors tremendous returns over the past year or two – and still represent great value.
U.S. Dollar Index Update
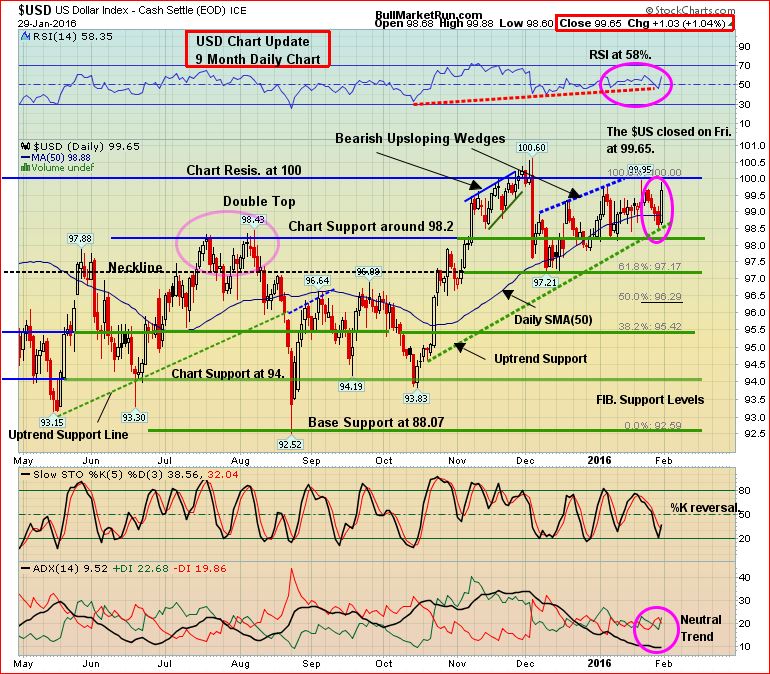
The U.S. Dollar Index is stubbornly holding support and got a lift Friday courtesy of the Bank of Japan. Meanwhile, Fed actions have directly contributed to a powerful greenback since the summer of 2014, and this has distorted a broad range of global markets including Oil. The danger now is that the U.S. Dollar Index breaks out above last year’s high of just below 101, and takes off again just on technical momentum. Ultimately, such an event undermines U.S. corporate earnings, hurts the manufacturing sector, and adds to deflationary pressures. It’ll be interesting to see if the Fed tries to “talk down” the dollar if the currency threatens to explode again to the upside in the coming days or weeks. The Fed’s mandate to guide inflation back up to 2% is under attack and doesn’t appear possible, especially with current fiscal policies, if the greenback keeps surging.
This chart suggests the Dollar Index has enough energy at the moment to at least vigorously challenge the 101 level where it turned back from last year. Monetary policies in the euro zone, China and Japan are clearly at odds with those in the U.S., even after the Fed tried to take a softer tone in its statement on Wednesday. It’s not inconceivable that Gold would continue to move higher on a U.S. dollar breakout and the stresses in markets that an even stronger greenback would create.
Gold
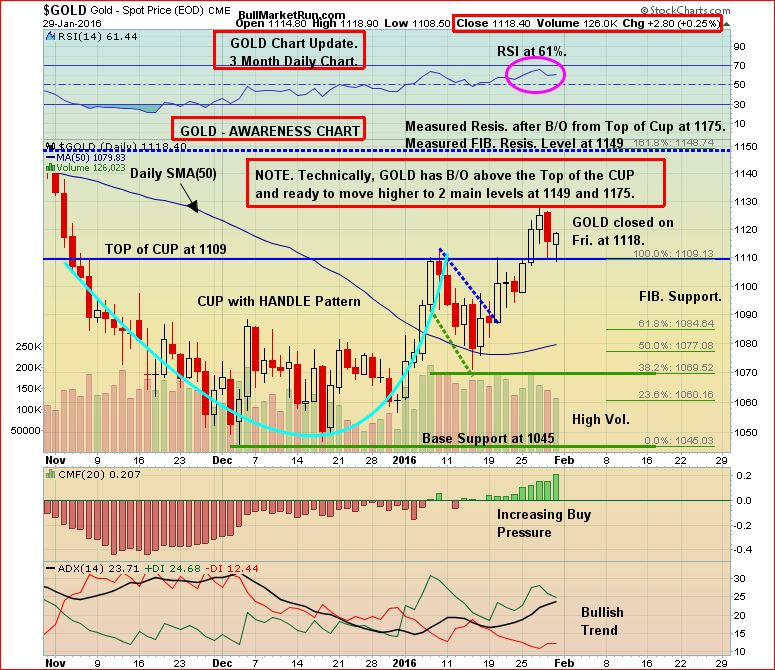
Gold has been the 2016 “safe haven” so far and curiously managed to stay firm at the end of the week despite a strong rally in equities and a big jump in the U.S. Dollar Index. For the week, bullion added another $20 an ounce to close at $1,118, confirming a breakout above important resistance at $1,110.
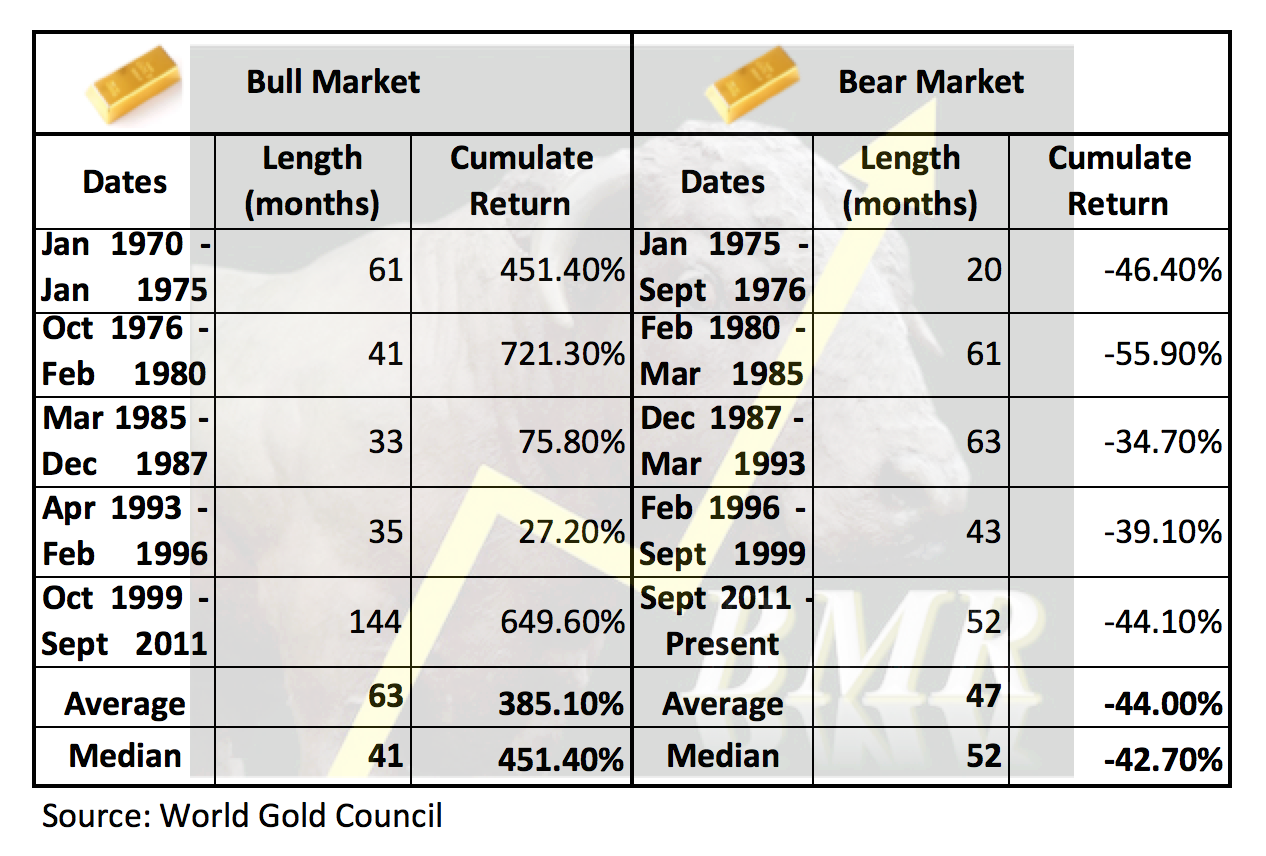
Bullion in 2015 posted its 3rd straight annual loss in U.S. Dollar terms for the first time since 1998. However, the bear market that started in Gold in late 2011 has reached the long-term average in terms of both duration (47 months) and decline (44%) as you can see in the table below.
A year from now, it’s entirely possible that investors will look back at January 2016 as the beginning of a new bull market in Gold. Right now, it’s simply too early to tell. The first major technical evidence of a new bull market would come if the metal were to blast through the $1,200 level with that key resistance then acting as new support.
The short-term picture for Gold is best defined by this 3-month daily chart. A classic pattern emerged recently featuring a cup-with handle, a breakout above the handle, and then a breakout above the top of the cup. This was accompanied by a reversal to the upside in the 50-day moving average (SMA). Buy pressure is increasing and the bullish trend is strong. Next Fib. resistance is $1,149.
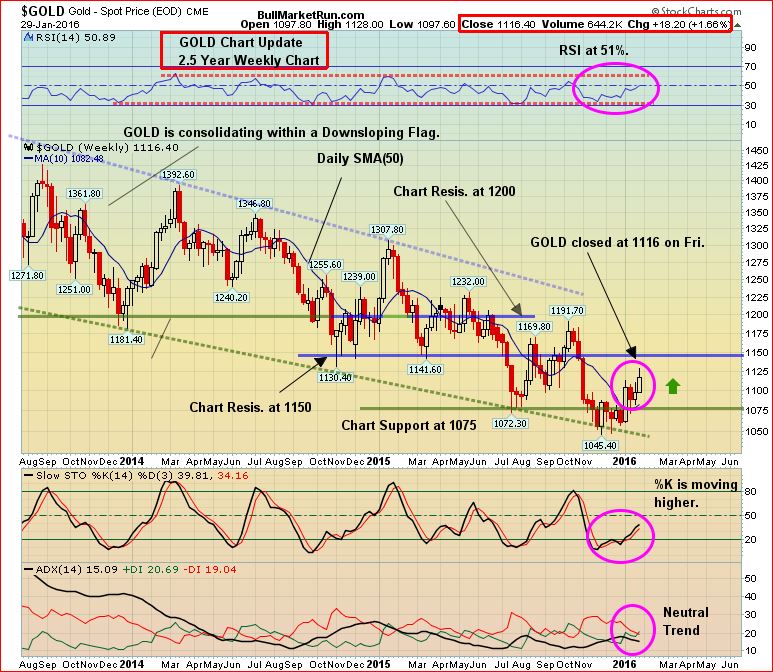
Gold 2.5-Year Weekly Chart
This chart from John has been an amazingly accurate guide for the direction of Gold over the past 2+ years. Each time the yellow metal has hit the bottom of the channel, it has bounced back vigorously which is why we turned bullish on bullion in November and recommended going long on the HGU (double long Gold stock ETF) around $3 ($15 post-consolidation) at the time (it closed Friday at $18.82).
All indicators (RSI-14, SS, ADX) on this chart are well-positioned to support a further climb in Gold this quarter to at least major resistance at $1,150. Where Gold goes from there is anyone’s guess at this point. The top of the channel right now is around $1,200, so any breakout above that level would indeed be extremely significant.
Silver gained 24 cents last week, closing at $14.24. Copper added a nickel for the 2nd straight week to finish at $2.06. Crude Oil gained another $1.55 a barrel to $33.74 while the U.S. Dollar Index finished unchanged for the week at 99.53, thanks to Friday’s nearly 1-point gain.
The “Big Picture” View Of Gold
As Frank Holmes so effectively illustrates at www.usfunds.com, the long-term bull market in Gold has been driven by both the Fear Trade and the Love Trade. The transfer of wealth from west to east, and the accumulation of wealth particularly in China and India, has had a huge impact on bullion and will continue to support prices. Despite Gold’s largest annual drop in 3 decades in 2013, and current weakness, the fundamental long-term case for the metal remains solidly intact based on the following factors (not necessarily in order of importance):
- Growing geopolitical tensions, fueled in part by the ISIS and al Qaeda, and a highly dangerous and expansionist Russia under Vladimir Putin, have put world security in the most precarious state since World War II;
- Weak leadership in the United States and Europe is emboldening enemies of the West;
- Currency instability and an overall lack of confidence in fiat currencies;
- Historically low interest rates/highly accommodating central banks around the world;
- Continued solid accumulation of Gold by China which intends to back up its currency with bullion;
- Massive government debt from the United States to Europe – a “day of reckoning” will come;
- Continued net buying of Gold by central banks around the world;
- Mine closings, a sharp reduction in exploration and a lack of major new discoveries – these factors should contribute to a noticeable tightening of supply over the next couple of years.